> ## Documentation Index
> Fetch the complete documentation index at: https://docs.summation.com/llms.txt
> Use this file to discover all available pages before exploring further.
# Artifacts
> Artifacts are the documents Addison generates from your data — reports, dashboards, and decks.
**Artifacts** are the documents Addison produces from your data and saves inside a [project](/features/projects): **Reports**, **Dashboards**, and **Decks**. They share a starting point — Addison **generates** one from a prompt or a [playbook](/features/artifacts/playbooks) and saves it to a project — and each type has its own home in the app. What you can do next varies: reports and decks support verification, version history, publishing, and export, while dashboards are edited live and export at the card level. The per-type pages below say exactly what each supports.
| Artifact | File | What it is | Where in the app |
| ------------------------------------------------ | -------- | ------------------------------------------------------------------------------------------- | -------------------------------------------------- |
| **[Reports](/features/artifacts/reports)** | `.sdoc` | An exec-ready written analysis — metrics, tables, and charts, each backed by data citations | **Reports** in the left sidebar (`/report`) |
| **[Dashboards](/features/artifacts/dashboards)** | `.sdash` | A collection of real-time tables, charts, and KPIs built from your data | **Dashboards** in the left sidebar (`/dashboards`) |
| **[Decks](/features/artifacts/decks)** | `.sdeck` | A slide-style presentation built from your content | **Decks** in the left sidebar (`/decks`) |
Addison also produces two **second-class artifacts**: file outputs rather than native Summation documents. They live in your project [files](/features/projects/files) and open in an in-app editor or viewer, but have no dedicated home in the left sidebar.
| Artifact | File | What it is | Built by |
| -------------------------------------- | ------- | -------------------------------------------------------------------- | ---------------------------------------------------- |
| **[Excel](/features/artifacts/excel)** | `.xlsx` | Exec-grade workbooks (models, forecasts, budgets) with live formulas | Addison's `xlsx` skill |
| **[HTML](/features/artifacts/html)** | `.html` | Standalone, styled HTML reports and pages | Addison's `html-template` / `workbook-report` skills |
A common flow is to **promote** one into a first-class artifact: ask Addison to rebuild an Excel model or an HTML report as a [dashboard](/features/artifacts/dashboards), [deck](/features/artifacts/decks), or [report](/features/artifacts/reports), so it gains data citations, verification, and a dedicated home in the app.
**[Playbooks](/features/artifacts/playbooks)** (`.spb`) sit alongside them. A playbook isn't an artifact itself — it's the reusable blueprint that *produces* them (first-class and second-class alike), on demand or on a schedule, so a recurring analysis comes out the same shape every time with fresh data. One playbook can produce several artifacts in a single run.
## Creating artifacts
You can create an artifact in a few ways:
* **In a chat with Addison** — describe what you want and Addison generates it.
* **From its dedicated page** — [Reports](/features/artifacts/reports) (`/report`), [Dashboards](/features/artifacts/dashboards) (`/dashboards`), and [Decks](/features/artifacts/decks) (`/decks`) each have a create button.
* **From a project** — use **Create** in the project's file list (see [Create artifacts from project](/features/projects#create-artifacts-from-project)).
* **By running a [playbook](/features/artifacts/playbooks)** — each run produces that playbook's declared outputs.
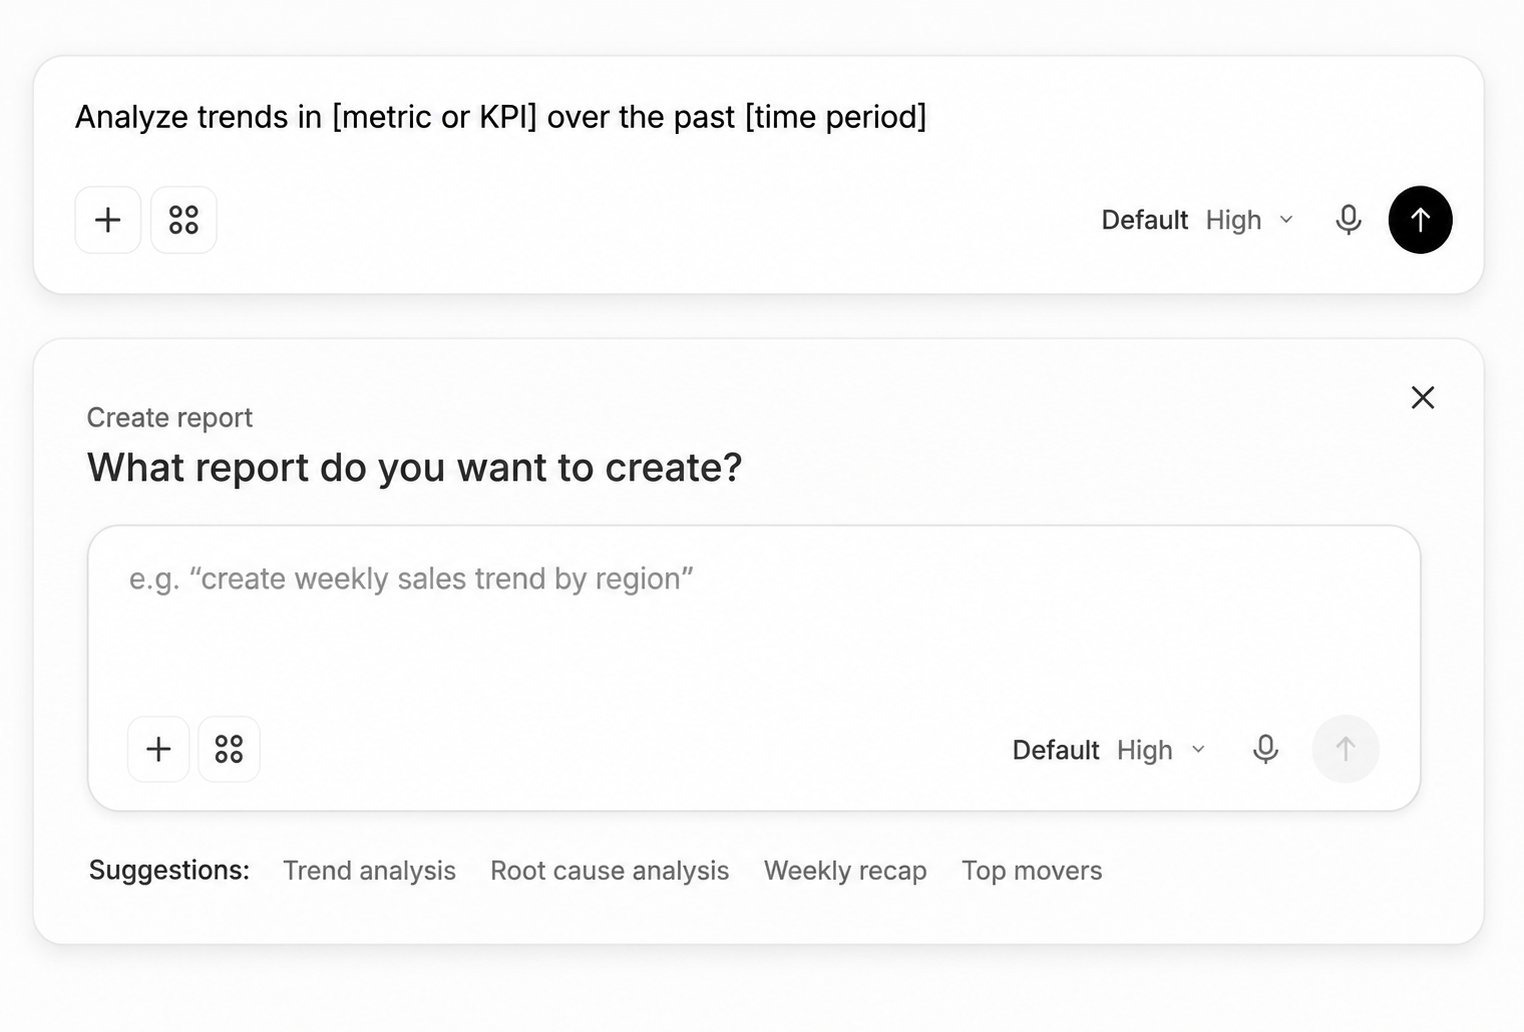 Written analyses backed by data citations.
Charts and KPIs built from your data.
Slide-style presentations of your content.
Reusable analyses that produce artifacts on demand or on a schedule.
Exec-grade `.xlsx` workbooks with live formulas.
Standalone, styled `.html` reports and pages.
Written analyses backed by data citations.
Charts and KPIs built from your data.
Slide-style presentations of your content.
Reusable analyses that produce artifacts on demand or on a schedule.
Exec-grade `.xlsx` workbooks with live formulas.
Standalone, styled `.html` reports and pages.