> ## Documentation Index
> Fetch the complete documentation index at: https://docs.summation.com/llms.txt
> Use this file to discover all available pages before exploring further.
# Reports
> Generate, verify, edit, style, share, and download AI-powered analytical reports.
A **report** (`.sdoc`) is an exec-ready analysis Addison writes from your data — from recurring business reviews to ad-hoc deep dives. Each report mixes written insights, data tables, and charts, and every finding is backed by **citations** that trace it to the underlying data. Reports are an [artifact](/features/artifacts) and live inside a [project](/features/projects).
 **Where each action lives in the UI** (for telling users where to click):
* **Reports home**: the **Reports** entry in the left nav sidebar (`/report`) — a table of your reports across all projects, with **Search**, a **Create report** button at the top-right, and a per-row **⋯** menu (Open in new tab, Rename, Duplicate, Download, Share, Delete).
* **Report viewer** (an open report): a top-right toolbar with the **verification badge** (shield → opens the Verification Hub), **Edit with AI**, **Styles**, and a **⋯** menu (**Share**, **Rename**, **Copy**, **Download** to PDF / Word, **Delete**). Version History opens as a side panel from the toolbar. The report body is **read-only**, so you don't type in it directly.
* **Ask or edit a spot**: select text, or a chart or a table, to get a floating toolbar with **Ask** and **Edit with AI**.
* **Trace a figure**: cited numbers/values are **underlined** — clicking one opens a **Value trace** popover showing the source query result with the exact data cell highlighted.
* Reports are `.sdoc` **folder packages** — a directory on disk that the app treats as one document (one `file_id`) — so they also appear as a single entry in a project's [file browser](/features/projects/files).
Report surfaces are gated by feature flags — `ui_reports_home_v1` (the Reports nav entry and `/report` home), `ui_create_report` (**Create report**), `ui_report_styles` (**Styles**), `tmp_report_versions_panel_sdoc` (Version History), `ui_enable_document_publish` (**Publish** / share link), `ui_document_pdf_export` and `ui_docx_export_pandocs` (**Download** to PDF / Word), and `tmp_repl_verification_v2_sdoc` plus the backend `backend_agent_verification_v2_p0` (the verification badge and Hub). If a workspace has one off, that part of the UI won't appear.
## Create a report
You can start a report a few ways — each hands Addison a prompt and streams the result.
Create a report from the **Reports page**: click **Create report** (top-right of `/report`). You can also **run a [playbook](/features/artifacts/playbooks)** that generates a report each run.
**Where each action lives in the UI** (for telling users where to click):
* **Reports home**: the **Reports** entry in the left nav sidebar (`/report`) — a table of your reports across all projects, with **Search**, a **Create report** button at the top-right, and a per-row **⋯** menu (Open in new tab, Rename, Duplicate, Download, Share, Delete).
* **Report viewer** (an open report): a top-right toolbar with the **verification badge** (shield → opens the Verification Hub), **Edit with AI**, **Styles**, and a **⋯** menu (**Share**, **Rename**, **Copy**, **Download** to PDF / Word, **Delete**). Version History opens as a side panel from the toolbar. The report body is **read-only**, so you don't type in it directly.
* **Ask or edit a spot**: select text, or a chart or a table, to get a floating toolbar with **Ask** and **Edit with AI**.
* **Trace a figure**: cited numbers/values are **underlined** — clicking one opens a **Value trace** popover showing the source query result with the exact data cell highlighted.
* Reports are `.sdoc` **folder packages** — a directory on disk that the app treats as one document (one `file_id`) — so they also appear as a single entry in a project's [file browser](/features/projects/files).
Report surfaces are gated by feature flags — `ui_reports_home_v1` (the Reports nav entry and `/report` home), `ui_create_report` (**Create report**), `ui_report_styles` (**Styles**), `tmp_report_versions_panel_sdoc` (Version History), `ui_enable_document_publish` (**Publish** / share link), `ui_document_pdf_export` and `ui_docx_export_pandocs` (**Download** to PDF / Word), and `tmp_repl_verification_v2_sdoc` plus the backend `backend_agent_verification_v2_p0` (the verification badge and Hub). If a workspace has one off, that part of the UI won't appear.
## Create a report
You can start a report a few ways — each hands Addison a prompt and streams the result.
Create a report from the **Reports page**: click **Create report** (top-right of `/report`). You can also **run a [playbook](/features/artifacts/playbooks)** that generates a report each run.

 **Two more ways:** from a project's **Create → Report** (see [Create artifacts from project](/features/projects#create-artifacts-from-project)), or by **asking Addison in a chat** (see [Creating artifacts](/features/artifacts#creating-artifacts)).
Generate a report from a prompt and stream progress (server-sent events).
**Note for agents:** this endpoint starts a **new Addison chat stream** to write the report. To avoid a chat that calls itself in a loop, report generation is **not exposed as a tool to Addison** — don't try to call it from inside a chat. It's for user-initiated creation, the public API, and playbooks.
## Find and open reports
The **Reports** page (`/report`, shown above) lists your reports across all projects, with columns for Name, Project, Created by, Playbook, and Last modified, plus search. Click one to open it. Reports also appear as `.sdoc` folder packages in their project's [file browser](/features/projects/files).
List a project's reports.
Show a single report.
## Rename and delete
A report is a `.sdoc` folder package, so you rename or delete it like any file — from the project [file browser](/features/projects/files#manage-a-file)'s **⋯** menu. Each report row on the Reports page (`/report`) also has a trailing **⋯** menu with **Rename** and **Delete**. Deleting can't be undone.
**Two more ways:** from a project's **Create → Report** (see [Create artifacts from project](/features/projects#create-artifacts-from-project)), or by **asking Addison in a chat** (see [Creating artifacts](/features/artifacts#creating-artifacts)).
Generate a report from a prompt and stream progress (server-sent events).
**Note for agents:** this endpoint starts a **new Addison chat stream** to write the report. To avoid a chat that calls itself in a loop, report generation is **not exposed as a tool to Addison** — don't try to call it from inside a chat. It's for user-initiated creation, the public API, and playbooks.
## Find and open reports
The **Reports** page (`/report`, shown above) lists your reports across all projects, with columns for Name, Project, Created by, Playbook, and Last modified, plus search. Click one to open it. Reports also appear as `.sdoc` folder packages in their project's [file browser](/features/projects/files).
List a project's reports.
Show a single report.
## Rename and delete
A report is a `.sdoc` folder package, so you rename or delete it like any file — from the project [file browser](/features/projects/files#manage-a-file)'s **⋯** menu. Each report row on the Reports page (`/report`) also has a trailing **⋯** menu with **Rename** and **Delete**. Deleting can't be undone.
 Delete a report. Requires `confirm=true`.
Rename a report.
## Verify a report
Verification is an automated audit of the report's accuracy. Click the **verification badge** (shield) in the toolbar to open the **Verification Hub**, then **Verify** to run it — the button reads **Refresh Verification** after the first run — streamed with progress. It reports four dimensions, each showing how many checks passed:
| Dimension | What it checks |
| --------------------- | -------------------------------------------------- |
| **Citation Accuracy** | Cited values are accurate and match their source |
| **Traceability** | Numbers, tables, and charts trace to their sources |
| **Claim Accuracy** | Facts, comparisons, and trends are valid |
| **Query Accuracy** | Queries are consistent and filters are correct |
Behind these, the underlying test set also runs an advisory **quality review** that surfaces suggestions without affecting the pass/fail badge.
If you edit the report after verifying, the Hub flags it (*"Edits have been made — refresh verification"*). The toolbar **verification badge** shows the current state:
| Status | Meaning |
| --------------- | ----------------------------------------------------------------------------------------- |
| **Unverified** | No verification has been run |
| **In progress** | Verification is running |
| **Verified** | Checks passed |
| **Stale** | The report changed since it was last verified — refresh to update |
| **Failed** | Verification found blocking issues |
| **Error** | Verification couldn't finish — the verifier crashed or timed out mid-run; re-run to retry |
Delete a report. Requires `confirm=true`.
Rename a report.
## Verify a report
Verification is an automated audit of the report's accuracy. Click the **verification badge** (shield) in the toolbar to open the **Verification Hub**, then **Verify** to run it — the button reads **Refresh Verification** after the first run — streamed with progress. It reports four dimensions, each showing how many checks passed:
| Dimension | What it checks |
| --------------------- | -------------------------------------------------- |
| **Citation Accuracy** | Cited values are accurate and match their source |
| **Traceability** | Numbers, tables, and charts trace to their sources |
| **Claim Accuracy** | Facts, comparisons, and trends are valid |
| **Query Accuracy** | Queries are consistent and filters are correct |
Behind these, the underlying test set also runs an advisory **quality review** that surfaces suggestions without affecting the pass/fail badge.
If you edit the report after verifying, the Hub flags it (*"Edits have been made — refresh verification"*). The toolbar **verification badge** shows the current state:
| Status | Meaning |
| --------------- | ----------------------------------------------------------------------------------------- |
| **Unverified** | No verification has been run |
| **In progress** | Verification is running |
| **Verified** | Checks passed |
| **Stale** | The report changed since it was last verified — refresh to update |
| **Failed** | Verification found blocking issues |
| **Error** | Verification couldn't finish — the verifier crashed or timed out mid-run; re-run to retry |
 **Traceability in action.** Every figure Addison cites is **underlined** — click one to open a **Value trace** showing the exact query result and the data cell behind it. Traceability is the verification check that all of these resolve to real source data.
 Verify a report and stream progress (server-sent events).
## Ask and edit with Addison
A report's body is **read-only** — you don't type into it. Instead, **highlight any section** (text, a chart, or a table) to get a floating toolbar with two actions:
* **Ask** — ask Addison a question about the highlighted spot (opens an "Ask Addison" box).
* **Edit with AI** — describe a change and Addison rewrites that part (opens a "Describe the edit…" box). You can also toggle **Edit with AI** in the toolbar to edit anywhere in the report.
You can also run `/incorporate-feedback` in chat to apply the **Edit with AI** feedback threads left on the report in one pass. It acts only on those Edit-with-AI feedback threads, not on ordinary comments — @-mentioning Addison in a comment spawns its own reply instead.
Verify a report and stream progress (server-sent events).
## Ask and edit with Addison
A report's body is **read-only** — you don't type into it. Instead, **highlight any section** (text, a chart, or a table) to get a floating toolbar with two actions:
* **Ask** — ask Addison a question about the highlighted spot (opens an "Ask Addison" box).
* **Edit with AI** — describe a change and Addison rewrites that part (opens a "Describe the edit…" box). You can also toggle **Edit with AI** in the toolbar to edit anywhere in the report.
You can also run `/incorporate-feedback` in chat to apply the **Edit with AI** feedback threads left on the report in one pass. It acts only on those Edit-with-AI feedback threads, not on ordinary comments — @-mentioning Addison in a comment spawns its own reply instead.


 Edit report content and apply comment feedback programmatically.
## Styles
Click **Styles** in the toolbar to restyle how a report looks. Pick a built-in style like **Editorial** or **Pulse** (including a dark theme), or a **Custom style**. The content stays the same; only the presentation changes.
Edit report content and apply comment feedback programmatically.
## Styles
Click **Styles** in the toolbar to restyle how a report looks. Pick a built-in style like **Editorial** or **Pulse** (including a dark theme), or a **Custom style**. The content stays the same; only the presentation changes.
 Apply a report style.
## Version history
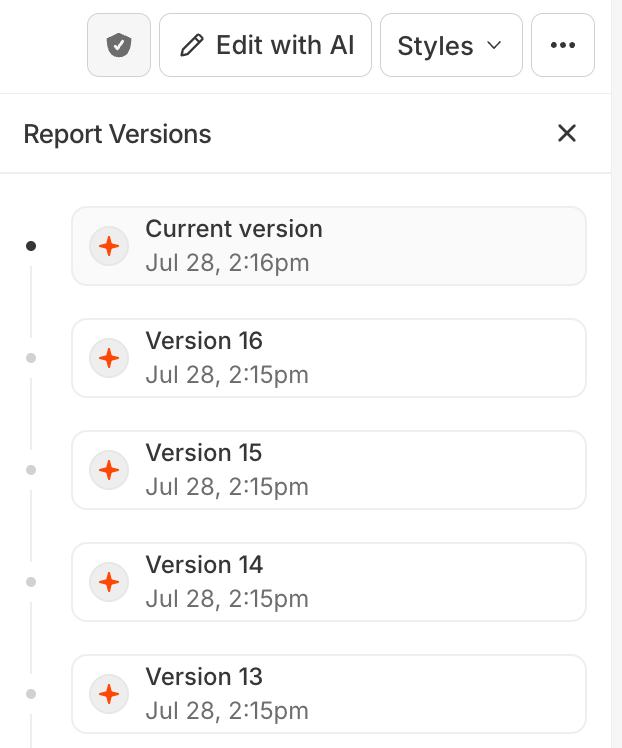
Every AI edit and manual change is saved as a version. Open **Version History** to see the full timeline and open an earlier **version**. Each version row has a **⋯** menu with **Rename Version** and **Revert Version** (reverting rolls the report back to that version and shows a *"Reverted to Version N"* toast). While you're viewing an older version, a *"Viewing version"* banner appears with a **View latest** link back to the current one, and editing, sharing, and export are disabled until you return to the latest.
Apply a report style.
## Version history
Every AI edit and manual change is saved as a version. Open **Version History** to see the full timeline and open an earlier **version**. Each version row has a **⋯** menu with **Rename Version** and **Revert Version** (reverting rolls the report back to that version and shows a *"Reverted to Version N"* toast). While you're viewing an older version, a *"Viewing version"* banner appears with a **View latest** link back to the current one, and editing, sharing, and export are disabled until you return to the latest.
 List a report's versions and revert to one.
## Share and publish
Open a report's **⋯** menu → **Share**, then **Publish** to create a **view-only** link for your organization — viewers can sign in or create an account to open it. Unpublish at any time.
List a report's versions and revert to one.
## Share and publish
Open a report's **⋯** menu → **Share**, then **Publish** to create a **view-only** link for your organization — viewers can sign in or create an account to open it. Unpublish at any time.
 Publish a report and manage its share link.
## Download
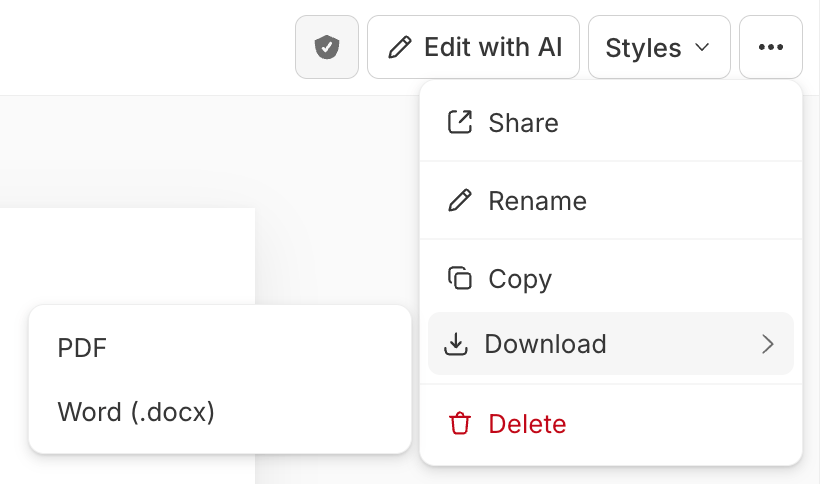
Open a report's **⋯** menu → **Download** and choose **PDF** or **Word (.docx)**.
Publish a report and manage its share link.
## Download
Open a report's **⋯** menu → **Download** and choose **PDF** or **Word (.docx)**.
 Export a report's content. `format` = `pdf`, `docx`, `markdown`, or `raw` (the API also offers Markdown and raw, which the in-app menu doesn't).