> ## Documentation Index
> Fetch the complete documentation index at: https://docs.summation.com/llms.txt
> Use this file to discover all available pages before exploring further.
# Tables
> The data behind everything in Summation — Summation tables you build, import, or compute, plus connector-backed tables.
**Tables** are the data behind everything in Summation — the rows your [reports](/features/artifacts/reports), [dashboards](/features/artifacts/dashboards), and [Addison](/features/addison) read from. They live in your organization's data grid at `/table` and come in two types: **Summation tables** (you create, import, or compute them in Summation) and **connector tables** (backed by an external source through a [connector](/features/connectors)).
 **Where each action lives in the UI** (for telling users where to click):
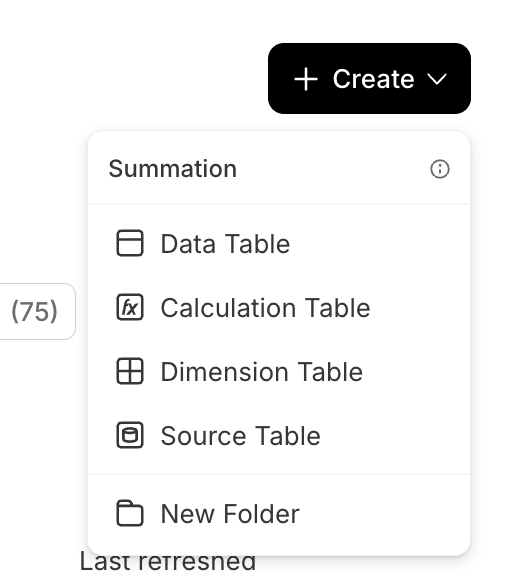
* **Tables home**: the **Tables** entry in the left nav sidebar (`/table`) — a searchable list across the data grid with **Name**, **Type** (Table or View), **Column** count, **Source**, and **Last refreshed** columns, plus **type filter chips** (All, Summation, and one per connector: Snowflake, Redshift, Iceberg, S3, Oracle). A **Create** menu at the top-right makes a **Data**, **Calculation**, **Dimension**, or **Source** table, or a folder. `/table` replaces the old `/data` and `/model/tables` pages.
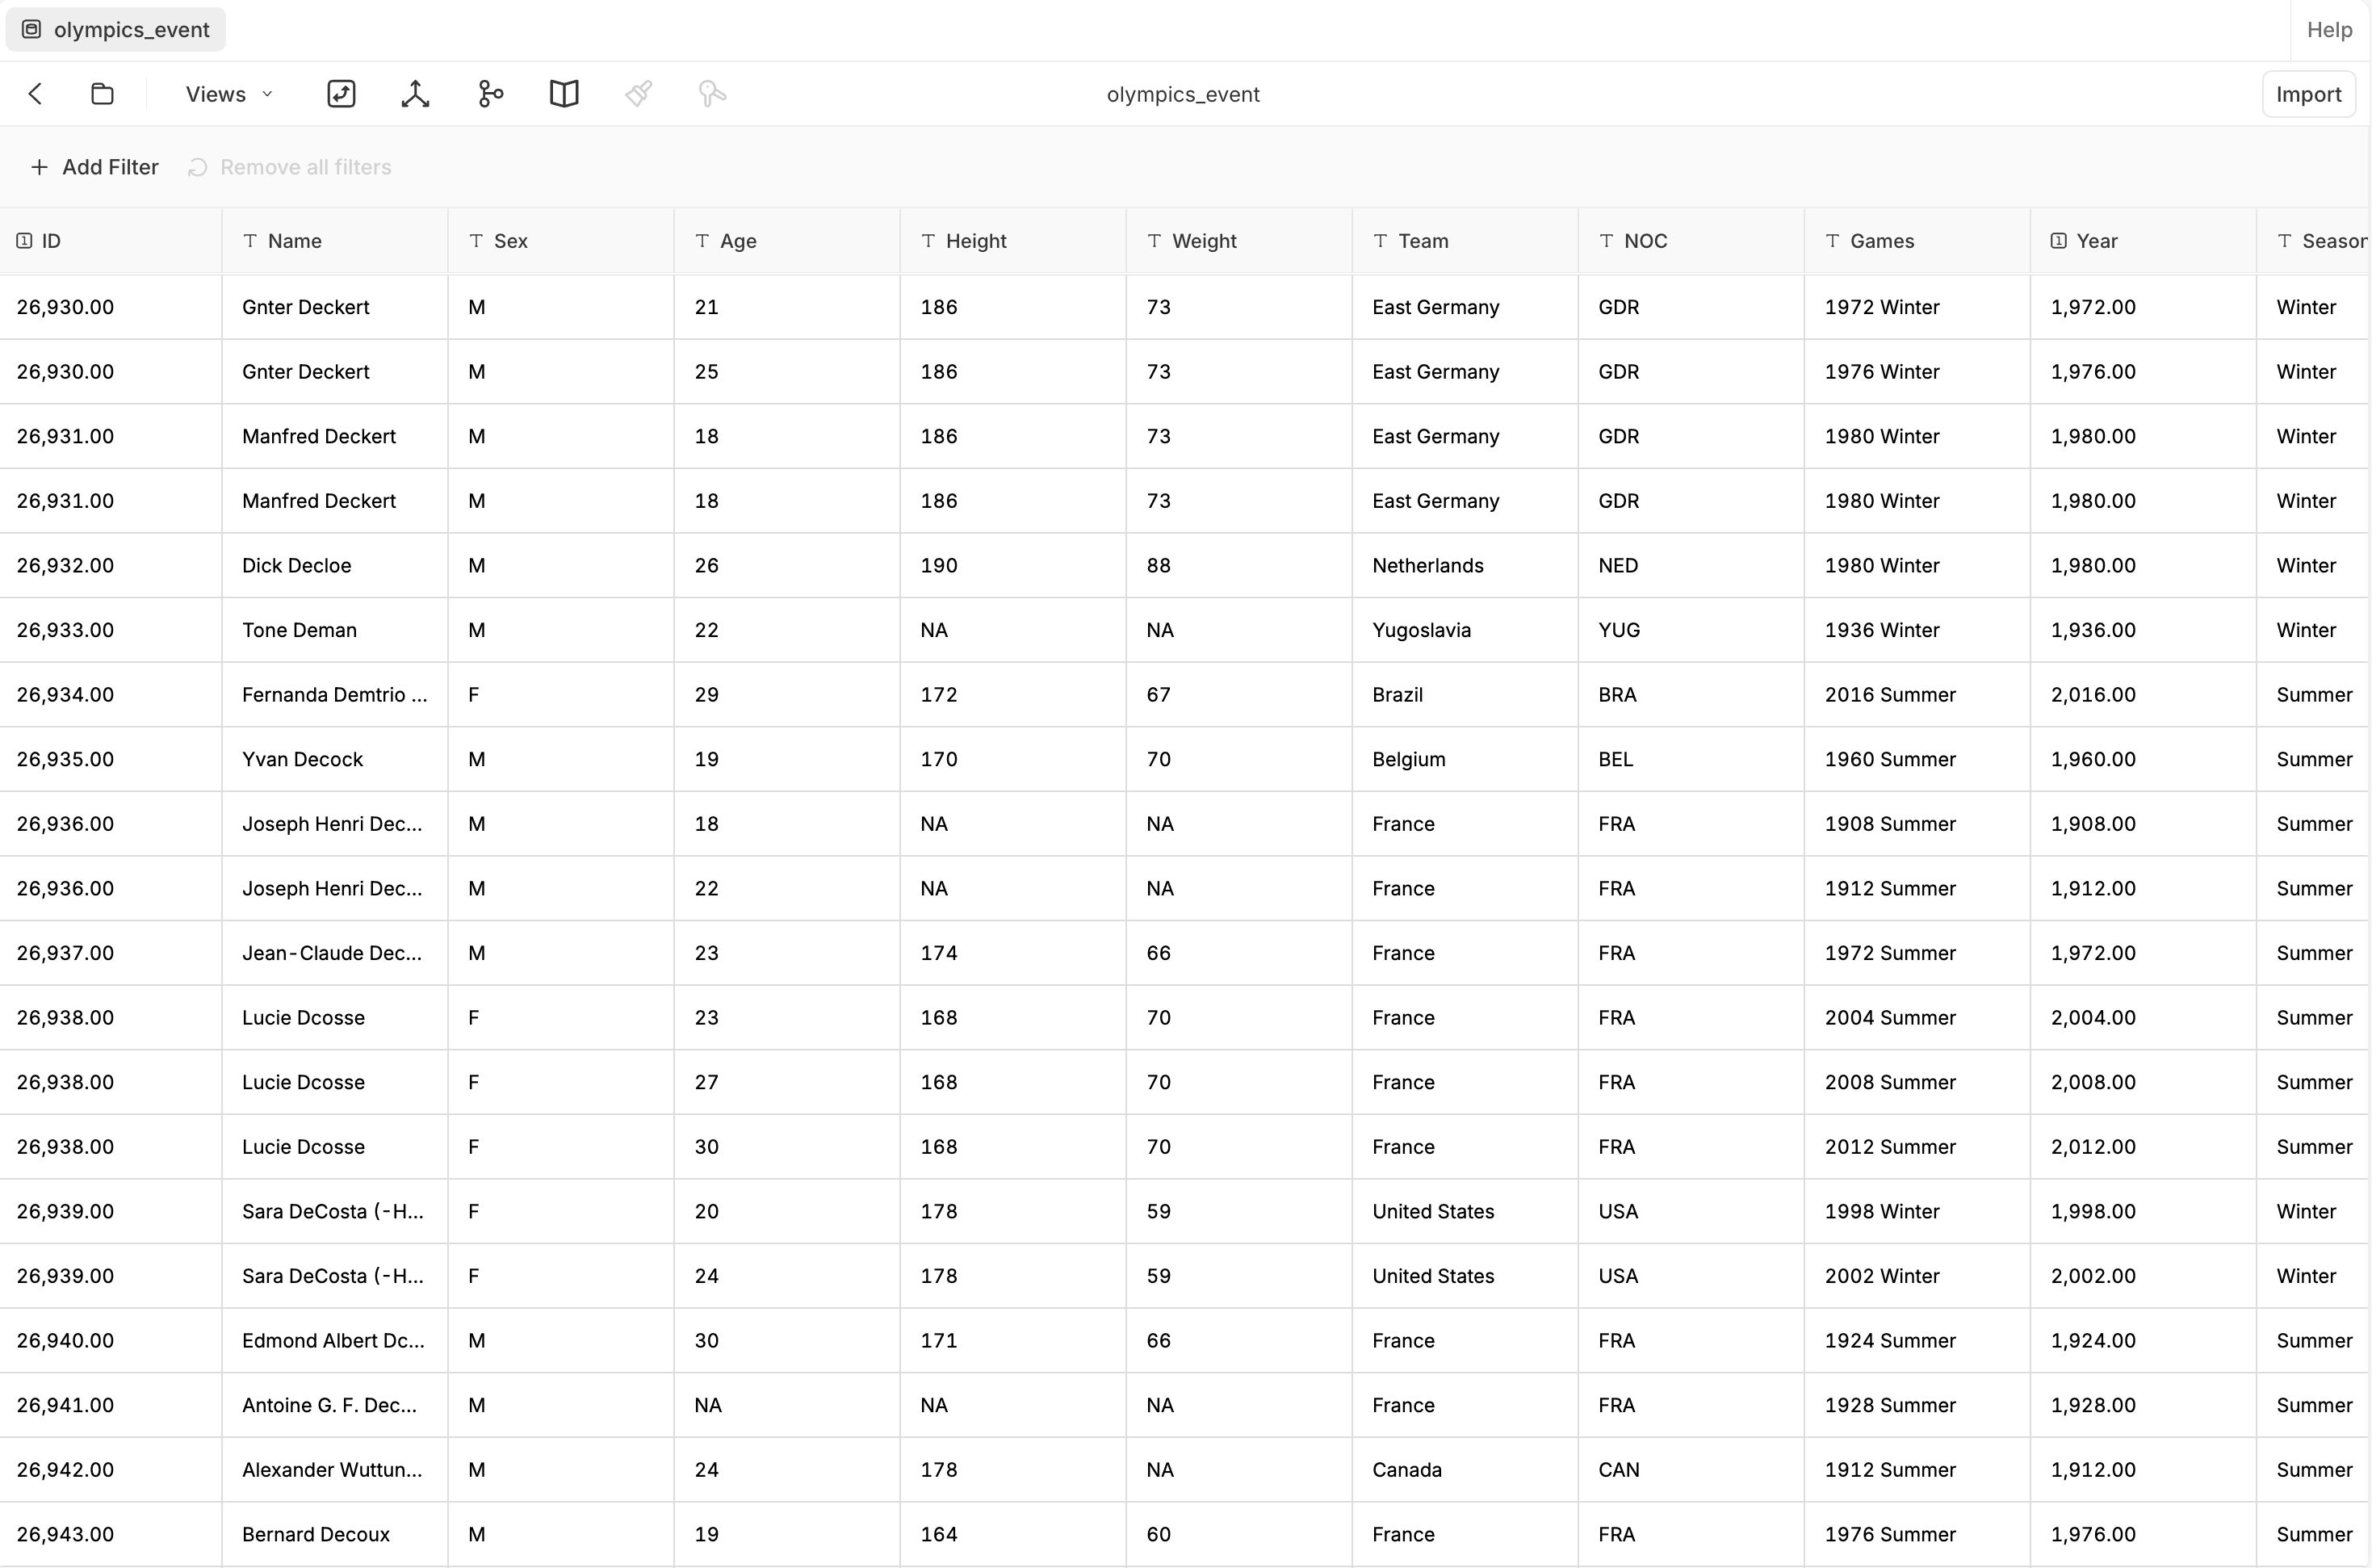
* **Open a table**: click a row to open its grid at `/table/{tableId}`; **Views** and **Export CSV** are in the grid's toolbar.
* **Kinds vs. type**: the four kinds you create (Data, Calculation, Dimension, Source) are all **Summation** tables. **Connector tables** aren't created here — they arrive through [connectors](/features/connectors) and appear filtered under their connector's type chip.
The Tables page is gated by feature flags — `ui_data_home_v1` (the page itself), `ui_data_home_csv_import` (the Source Table option and importer), and `ui_data_home_sidebar` (the Data files sidebar); with one of these off, that part won't appear. The `ui_data_browser_table_freshness` flag only changes the freshness column's label — on, it reads **Last refreshed**; off, it falls back to **Last modified**. The column stays either way.
## Find and open a table
The **Tables** page (`/table`, shown above) lists every table and view in the data grid. Filter by source with the type chips (Summation or a connector), search within a folder, and click a table to open its grid. In the grid you can browse rows, apply **Views** and filters, and **Export CSV**.
**Where each action lives in the UI** (for telling users where to click):
* **Tables home**: the **Tables** entry in the left nav sidebar (`/table`) — a searchable list across the data grid with **Name**, **Type** (Table or View), **Column** count, **Source**, and **Last refreshed** columns, plus **type filter chips** (All, Summation, and one per connector: Snowflake, Redshift, Iceberg, S3, Oracle). A **Create** menu at the top-right makes a **Data**, **Calculation**, **Dimension**, or **Source** table, or a folder. `/table` replaces the old `/data` and `/model/tables` pages.
* **Open a table**: click a row to open its grid at `/table/{tableId}`; **Views** and **Export CSV** are in the grid's toolbar.
* **Kinds vs. type**: the four kinds you create (Data, Calculation, Dimension, Source) are all **Summation** tables. **Connector tables** aren't created here — they arrive through [connectors](/features/connectors) and appear filtered under their connector's type chip.
The Tables page is gated by feature flags — `ui_data_home_v1` (the page itself), `ui_data_home_csv_import` (the Source Table option and importer), and `ui_data_home_sidebar` (the Data files sidebar); with one of these off, that part won't appear. The `ui_data_browser_table_freshness` flag only changes the freshness column's label — on, it reads **Last refreshed**; off, it falls back to **Last modified**. The column stays either way.
## Find and open a table
The **Tables** page (`/table`, shown above) lists every table and view in the data grid. Filter by source with the type chips (Summation or a connector), search within a folder, and click a table to open its grid. In the grid you can browse rows, apply **Views** and filters, and **Export CSV**.
 List tables in the data grid.
Show a table's definition — its columns, types, and source, plus an `appendable` annotation for whether it accepts row appends. (Catalog metadata is a separate endpoint, below.)
Preview a table's rows.
## Create a table
Use **Create** (top-right of `/table`) to make a Summation table. Each kind has its own page:
| Table kind | Type | Guide |
| --------------------- | ---------------------------------------------------------------------------------------------- | -------------------------------------------------- |
| **Data table** | `TableType` `DATA` | [Data tables](/features/tables/data) |
| **Source table** | Not a `TableType` — a `FILE_IMPORT` source table, created via its own `CreateSourceTable` call | [Source tables](/features/tables/source) |
| **Calculation table** | `TableType` `CALCULATION` | [Calculation tables](/features/tables/calculation) |
| **Dimension table** | `TableType` `DIMENSION` | [Dimension tables](/features/tables/dimension) |
| **Connector table** | Connector-backed (external) | [Connectors](/features/connectors) |
List tables in the data grid.
Show a table's definition — its columns, types, and source, plus an `appendable` annotation for whether it accepts row appends. (Catalog metadata is a separate endpoint, below.)
Preview a table's rows.
## Create a table
Use **Create** (top-right of `/table`) to make a Summation table. Each kind has its own page:
| Table kind | Type | Guide |
| --------------------- | ---------------------------------------------------------------------------------------------- | -------------------------------------------------- |
| **Data table** | `TableType` `DATA` | [Data tables](/features/tables/data) |
| **Source table** | Not a `TableType` — a `FILE_IMPORT` source table, created via its own `CreateSourceTable` call | [Source tables](/features/tables/source) |
| **Calculation table** | `TableType` `CALCULATION` | [Calculation tables](/features/tables/calculation) |
| **Dimension table** | `TableType` `DIMENSION` | [Dimension tables](/features/tables/dimension) |
| **Connector table** | Connector-backed (external) | [Connectors](/features/connectors) |
 ## Catalog
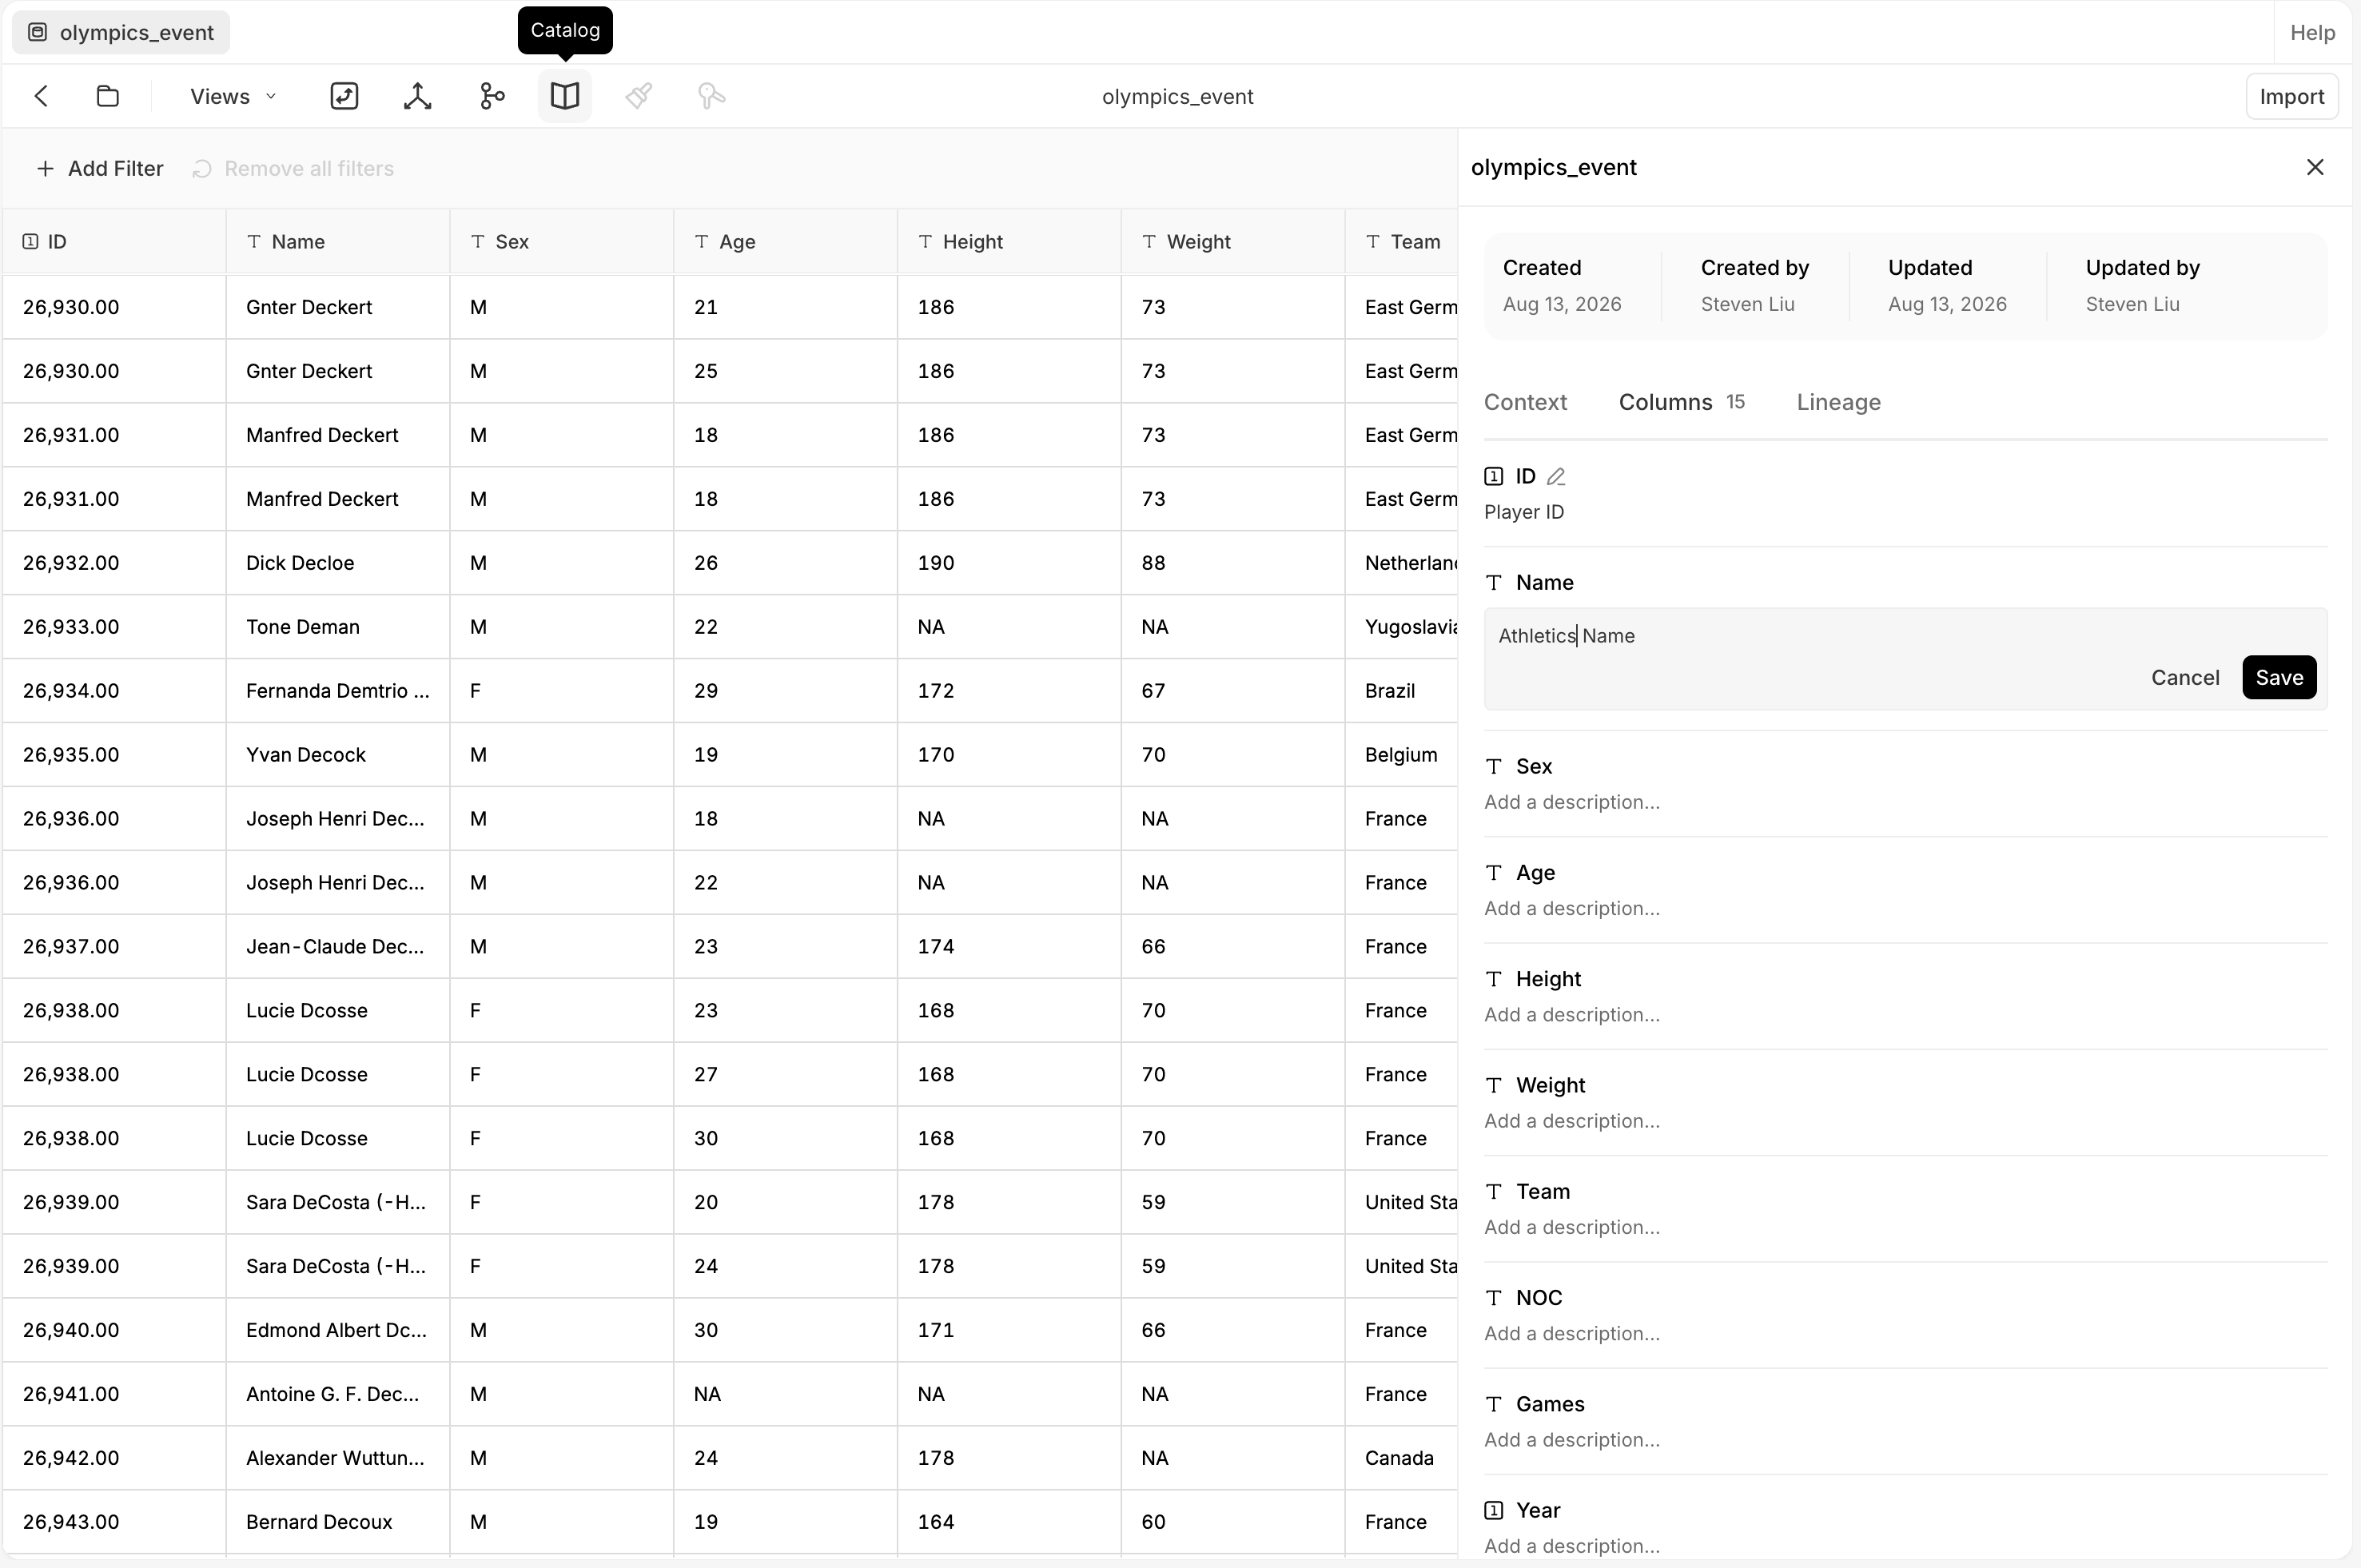
Every table and view carries a **catalog** — the metadata that describes it and its columns, and what [Addison](/features/addison) reads to understand your data. Open it from the **Catalog** button (book icon) in a table's toolbar.
* **Table**: a **description**, **owner**, **source system**, and an **agent description** written for Addison (what the entity contains and when to use it). (A table also has a **modeling tier**, but it's set through the API only — it isn't shown or editable here.)
* **View**: only a **description**, **owner**, and **agent description**.
* **Columns**: a description and an agent description each.
In the panel, the **Context** tab shows the agent-facing **System Description** with a **User Defined** override you can edit; the **Columns** tab edits per-column descriptions. A standalone **Data Catalog** home browses all of it across the grid.
Because Addison relies on it, richer catalog metadata (especially agent descriptions) directly improves its answers. Separately, a [project](/features/projects) attaches specific tables and views to its catalog to control what Addison can see there; an empty project catalog means the agent has no data context.
## Catalog
Every table and view carries a **catalog** — the metadata that describes it and its columns, and what [Addison](/features/addison) reads to understand your data. Open it from the **Catalog** button (book icon) in a table's toolbar.
* **Table**: a **description**, **owner**, **source system**, and an **agent description** written for Addison (what the entity contains and when to use it). (A table also has a **modeling tier**, but it's set through the API only — it isn't shown or editable here.)
* **View**: only a **description**, **owner**, and **agent description**.
* **Columns**: a description and an agent description each.
In the panel, the **Context** tab shows the agent-facing **System Description** with a **User Defined** override you can edit; the **Columns** tab edits per-column descriptions. A standalone **Data Catalog** home browses all of it across the grid.
Because Addison relies on it, richer catalog metadata (especially agent descriptions) directly improves its answers. Separately, a [project](/features/projects) attaches specific tables and views to its catalog to control what Addison can see there; an empty project catalog means the agent has no data context.
 List table catalog metadata across the tenant.
Show a table's catalog.
Update a table's catalog (description, owner, source system, modeling tier, agent description).
## Lineage
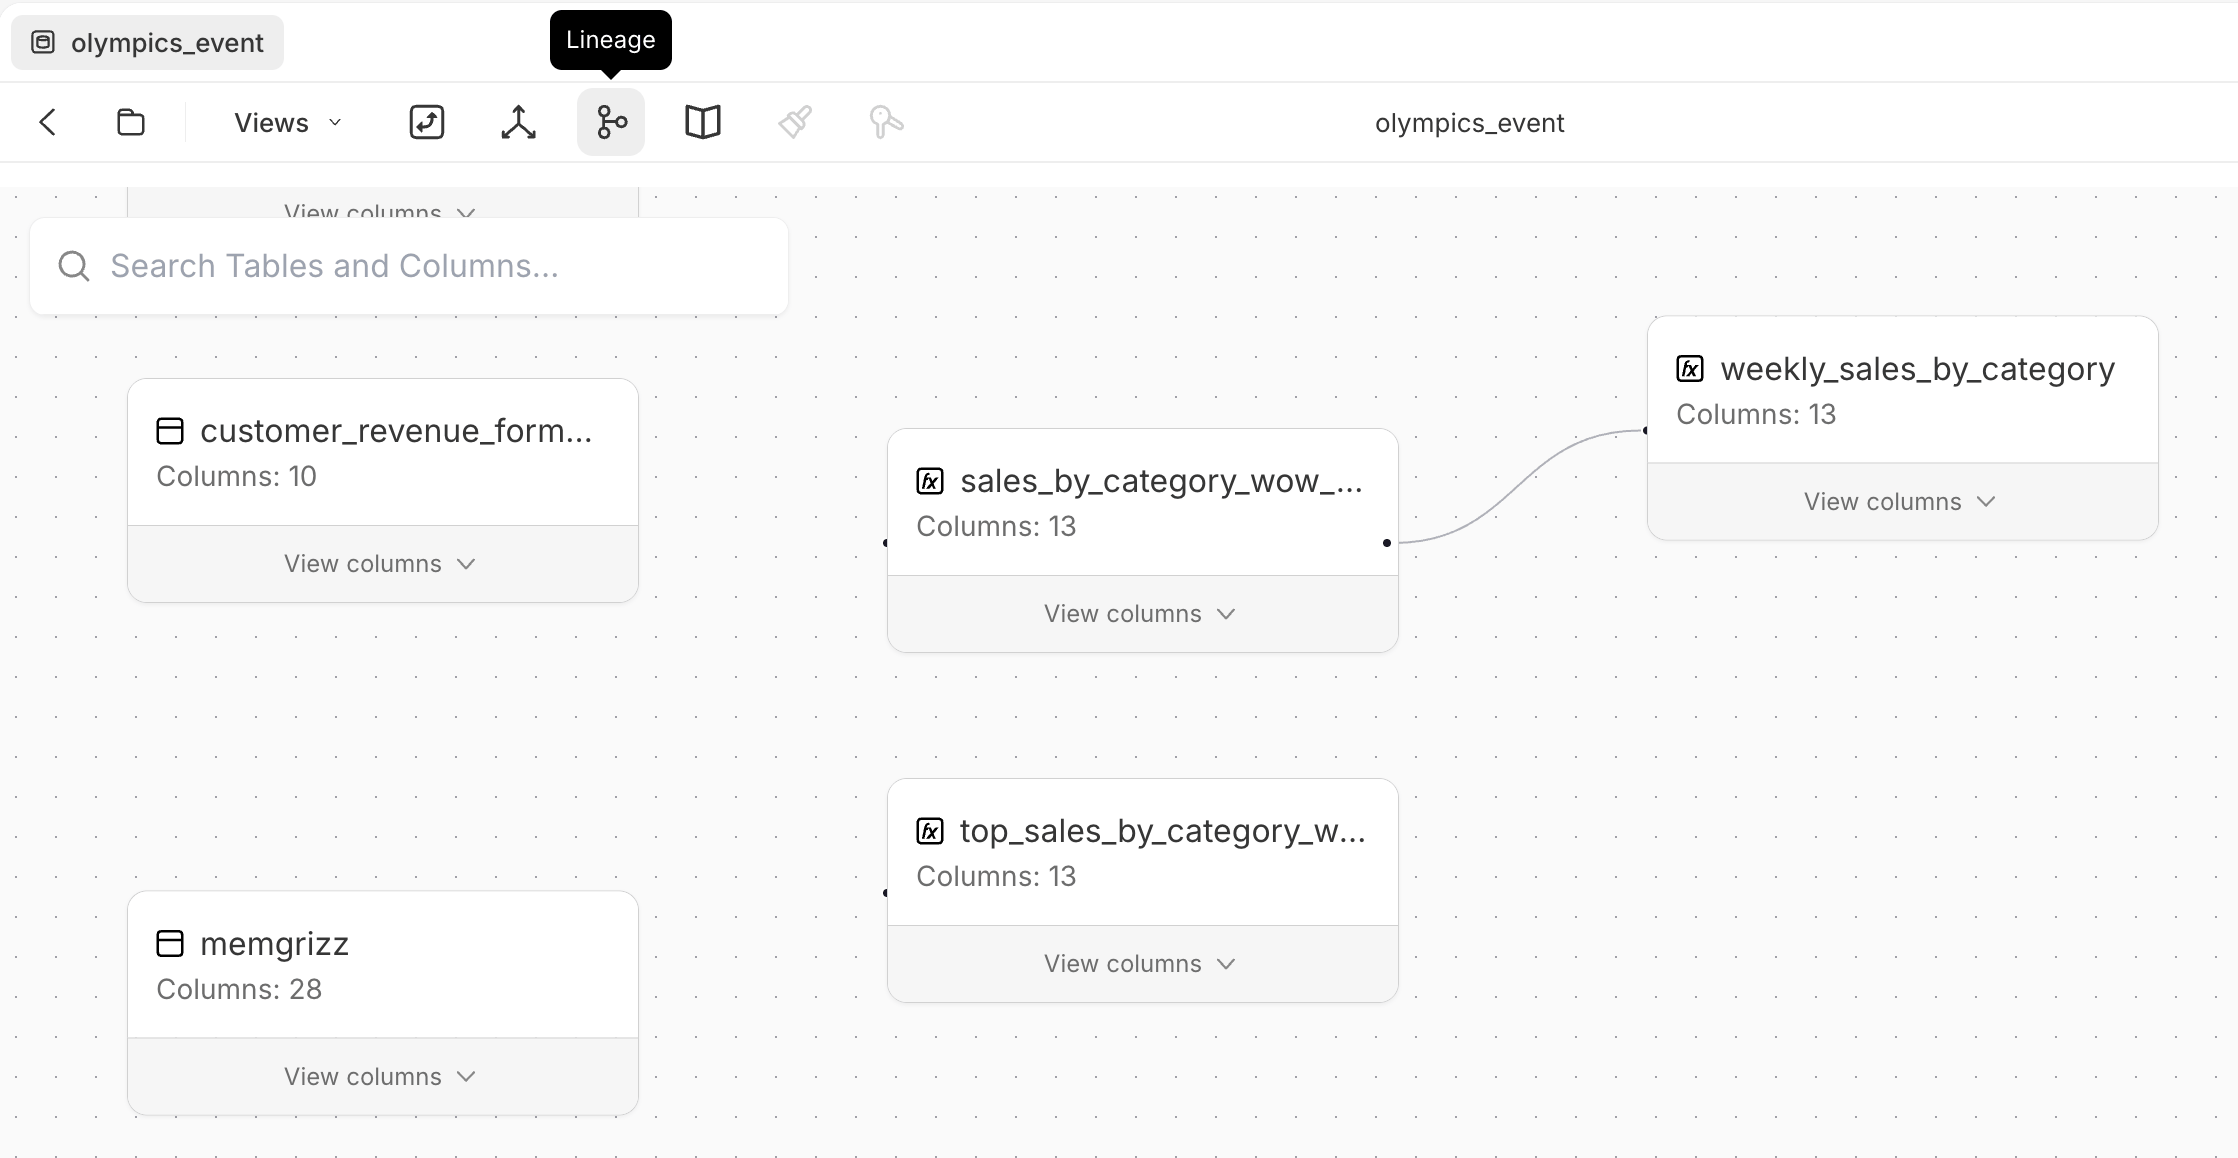
Open **Lineage** from the table toolbar (or the Catalog panel's **Lineage** tab) to see what a table is built from and what depends on it — a graph linking source tables to the [calculation tables](/features/tables/calculation) and views derived from them. Expand a node's **View columns** for column-level lineage, and search for a table or column.
List table catalog metadata across the tenant.
Show a table's catalog.
Update a table's catalog (description, owner, source system, modeling tier, agent description).
## Lineage
Open **Lineage** from the table toolbar (or the Catalog panel's **Lineage** tab) to see what a table is built from and what depends on it — a graph linking source tables to the [calculation tables](/features/tables/calculation) and views derived from them. Expand a node's **View columns** for column-level lineage, and search for a table or column.
 Show a table's lineage.
## Delete a table
There's no delete action in the Tables UI. A table row's actions are **Open data catalog**, **Open in new tab**, **Copy link**, **Find in folder**, and **Rename** — none of them delete. Deleting a table is API-only (see **Via the API**) or done through admin tooling, and can't be undone.
Delete a table. Requires the `agent:write` scope and `confirm=true` (a `400` otherwise); optional `force` and `metadata_only` query params.
Show a table's lineage.
## Delete a table
There's no delete action in the Tables UI. A table row's actions are **Open data catalog**, **Open in new tab**, **Copy link**, **Find in folder**, and **Rename** — none of them delete. Deleting a table is API-only (see **Via the API**) or done through admin tooling, and can't be undone.
Delete a table. Requires the `agent:write` scope and `confirm=true` (a `400` otherwise); optional `force` and `metadata_only` query params.