> ## Documentation Index
> Fetch the complete documentation index at: https://docs.summation.com/llms.txt
> Use this file to discover all available pages before exploring further.
# Views
> A saved pivot or perspective over a table — grouping, aggregations, filters, and sorting, read live.
A **view** is a saved **pivot or perspective** over a single [table](/features/tables) — a stored arrangement of grouping, aggregations, filters, sorting, and calculated fields. It reads **live** from the table (nothing is materialized), and it's a first-class object: views appear on the [Tables](/features/tables) page with **Type = View**, and [dashboard cards](/features/artifacts/dashboards#data-sources) are built on the same view shape.
**Where each action lives in the UI** (for telling users where to click):
* A view always belongs to a **parent table**. Open a table (`/table/{tableId}`), then use the **Views** dropdown in the grid toolbar to switch between **Default** (the raw table) and its saved views; a view opens at `/table/{tableId}/views/{viewId}`.
* **Create/edit**: change the pivot (grouping, values, filters, sort) on Default or a view; that starts a **draft**. Save it with **Save** (update this view), **Save as New** (make a new view), or **Reset** (discard the draft).
* **Delete**: the trash affordance on a view's row in the Views dropdown.
* A view is a read-only live slice; for a new persisted or joinable dataset use a [calculation table](/features/tables/calculation) instead.
Calculated fields inside a view are gated by the `calculated_fields` feature flag. The `summation_views` flag does **not** gate whether views appear — views work with it off (it defaults to false); it only toggles the ViewCard header's copy / download / open actions and the calculated-field entry point, not the Views dropdown, pivot panel, Save, or the view route.
## What you can do
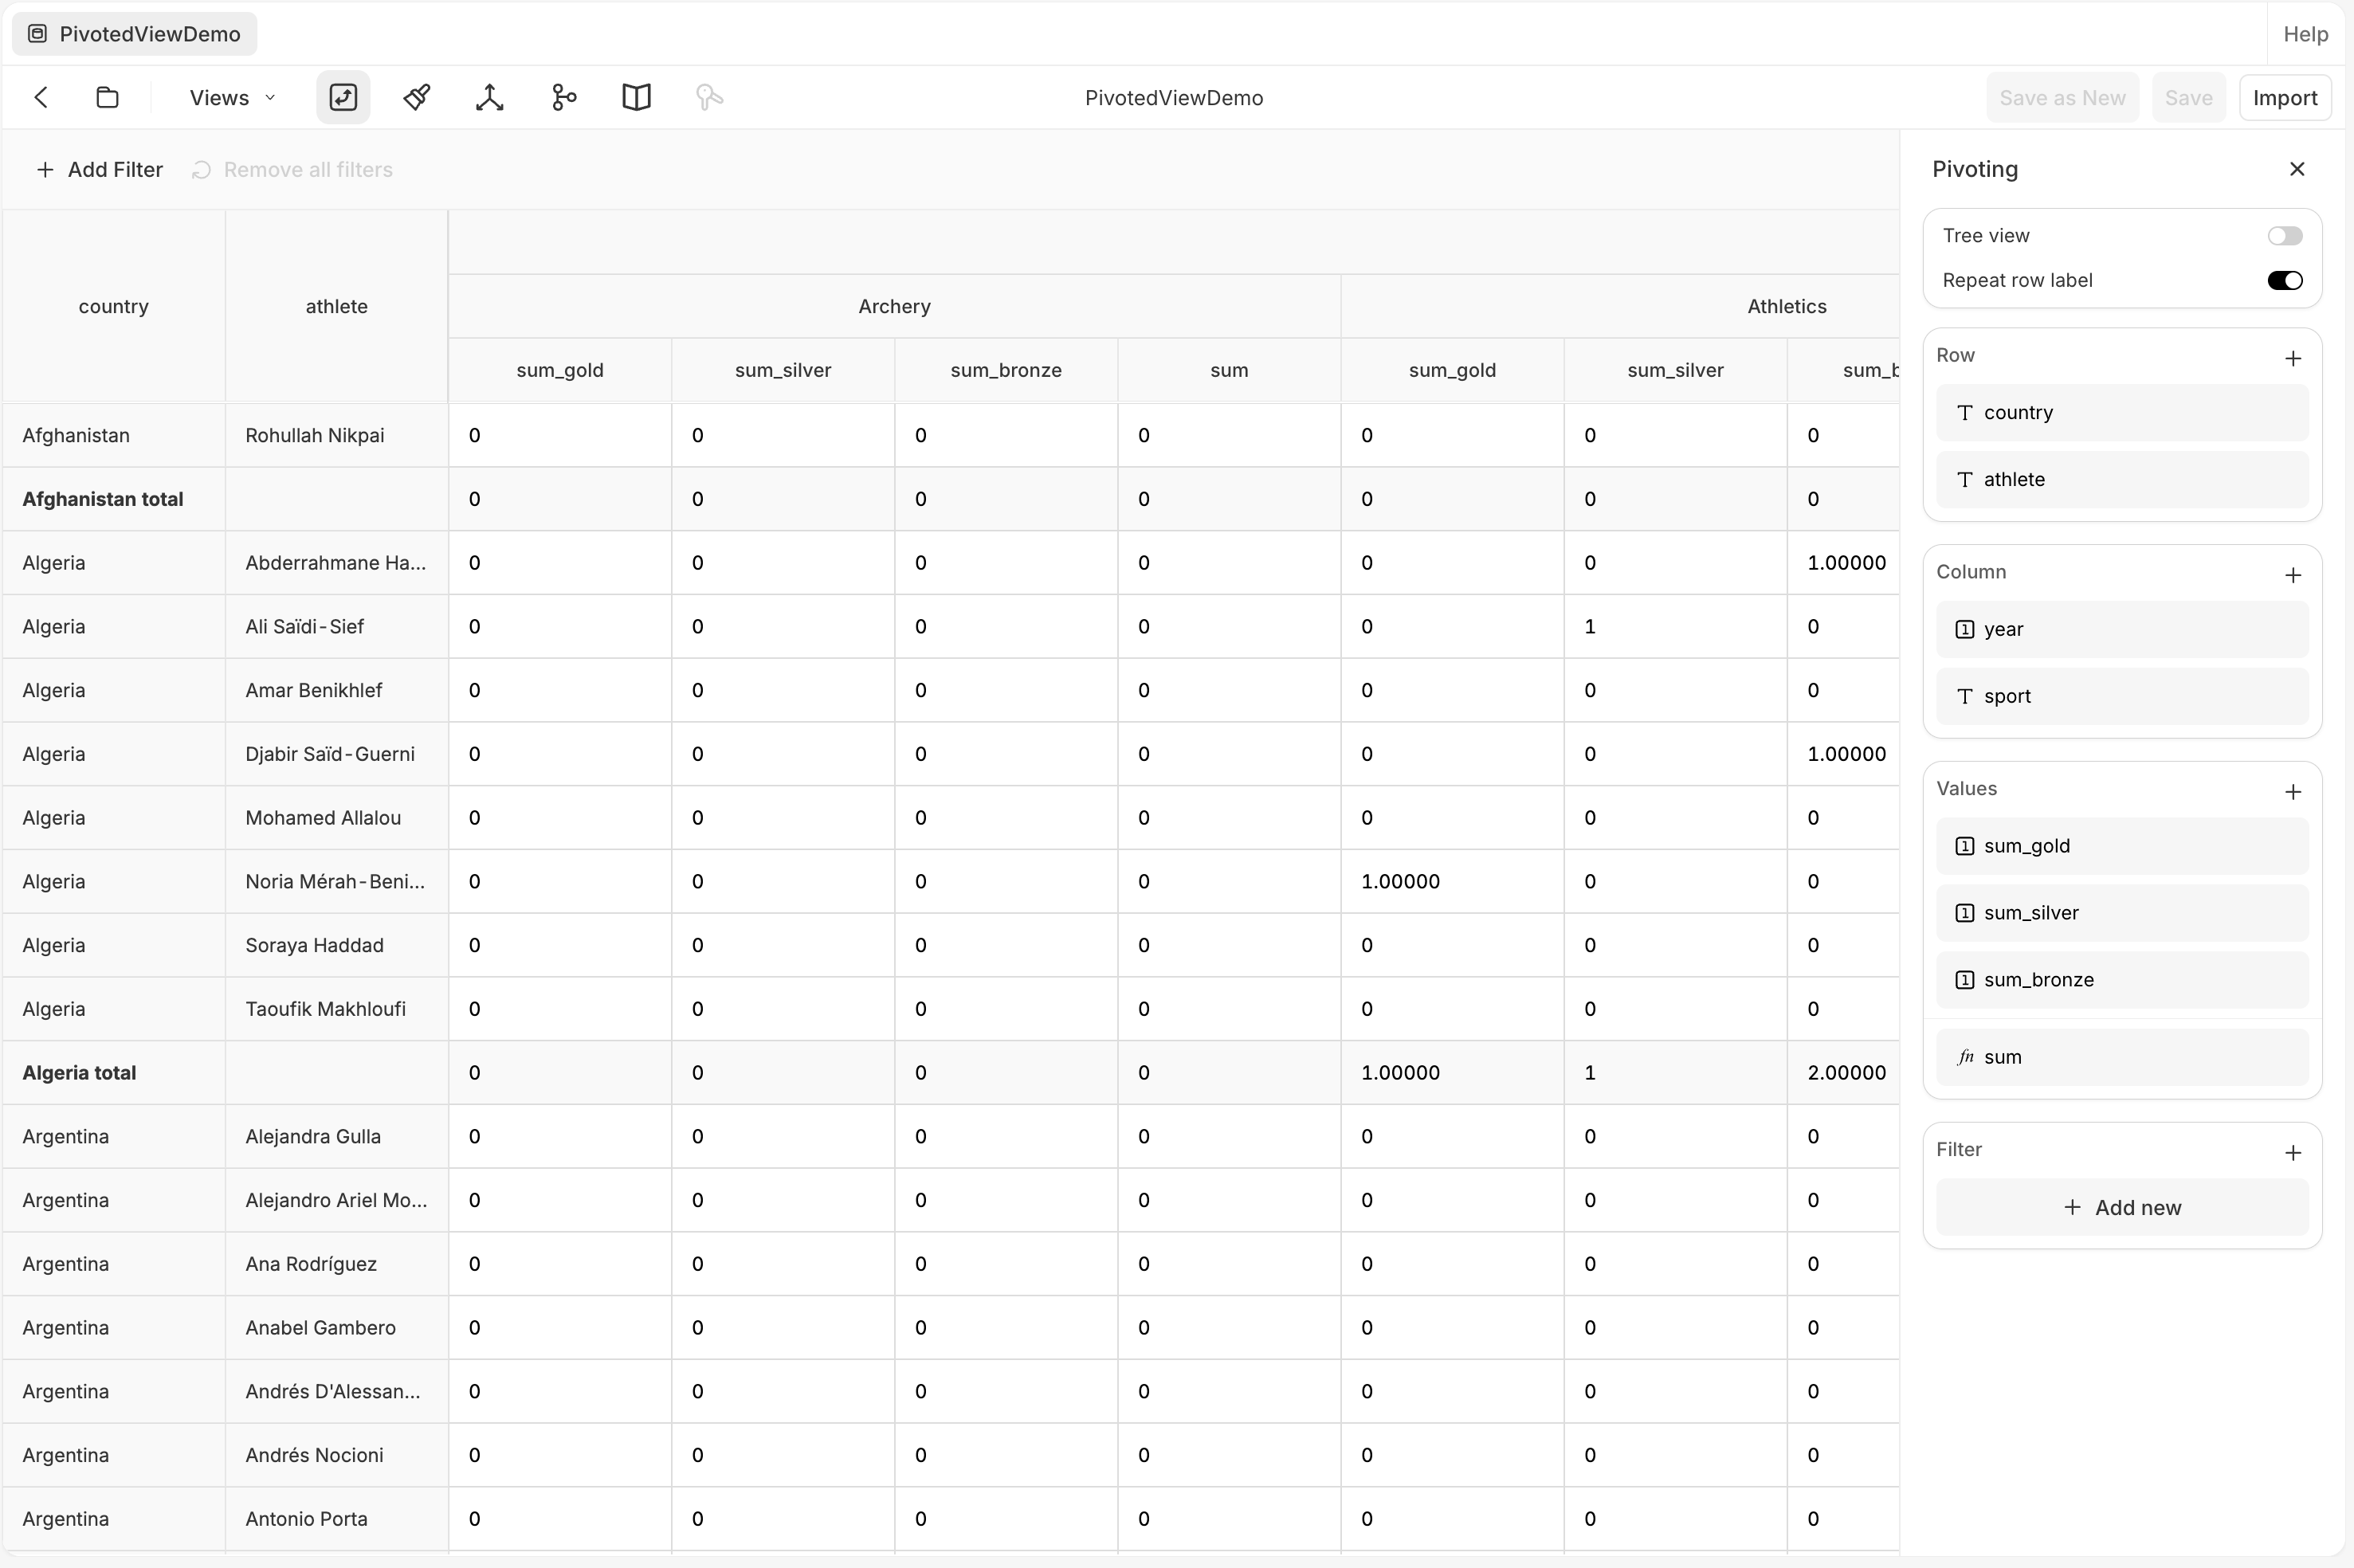
Build a view from the **Pivoting** panel — the pivot icon in the table toolbar. Its sections are **Row**, **Column**, **Values**, and **Filter**:
* **Row** — group by one or more columns down the left. Ordering lives inside each Row field (its **Order:** and **Sort by:** controls), as do its **Show total** and **Show grand total** checkboxes.
* **Column** — pivot columns across the top, with the same per-field total checkboxes.
* **Values** — the measures to aggregate (sum, count, average, min, max, median, distinct count), plus calculated expressions.
* **Filter** — restrict which rows the view includes.
Below these, an untitled card holds just **Tree view** and **Repeat row label**.
 A view is a lightweight, live slice of one table. When you need a new persisted or joinable dataset, create a [calculation table](/features/tables/calculation) instead.
## Formatting
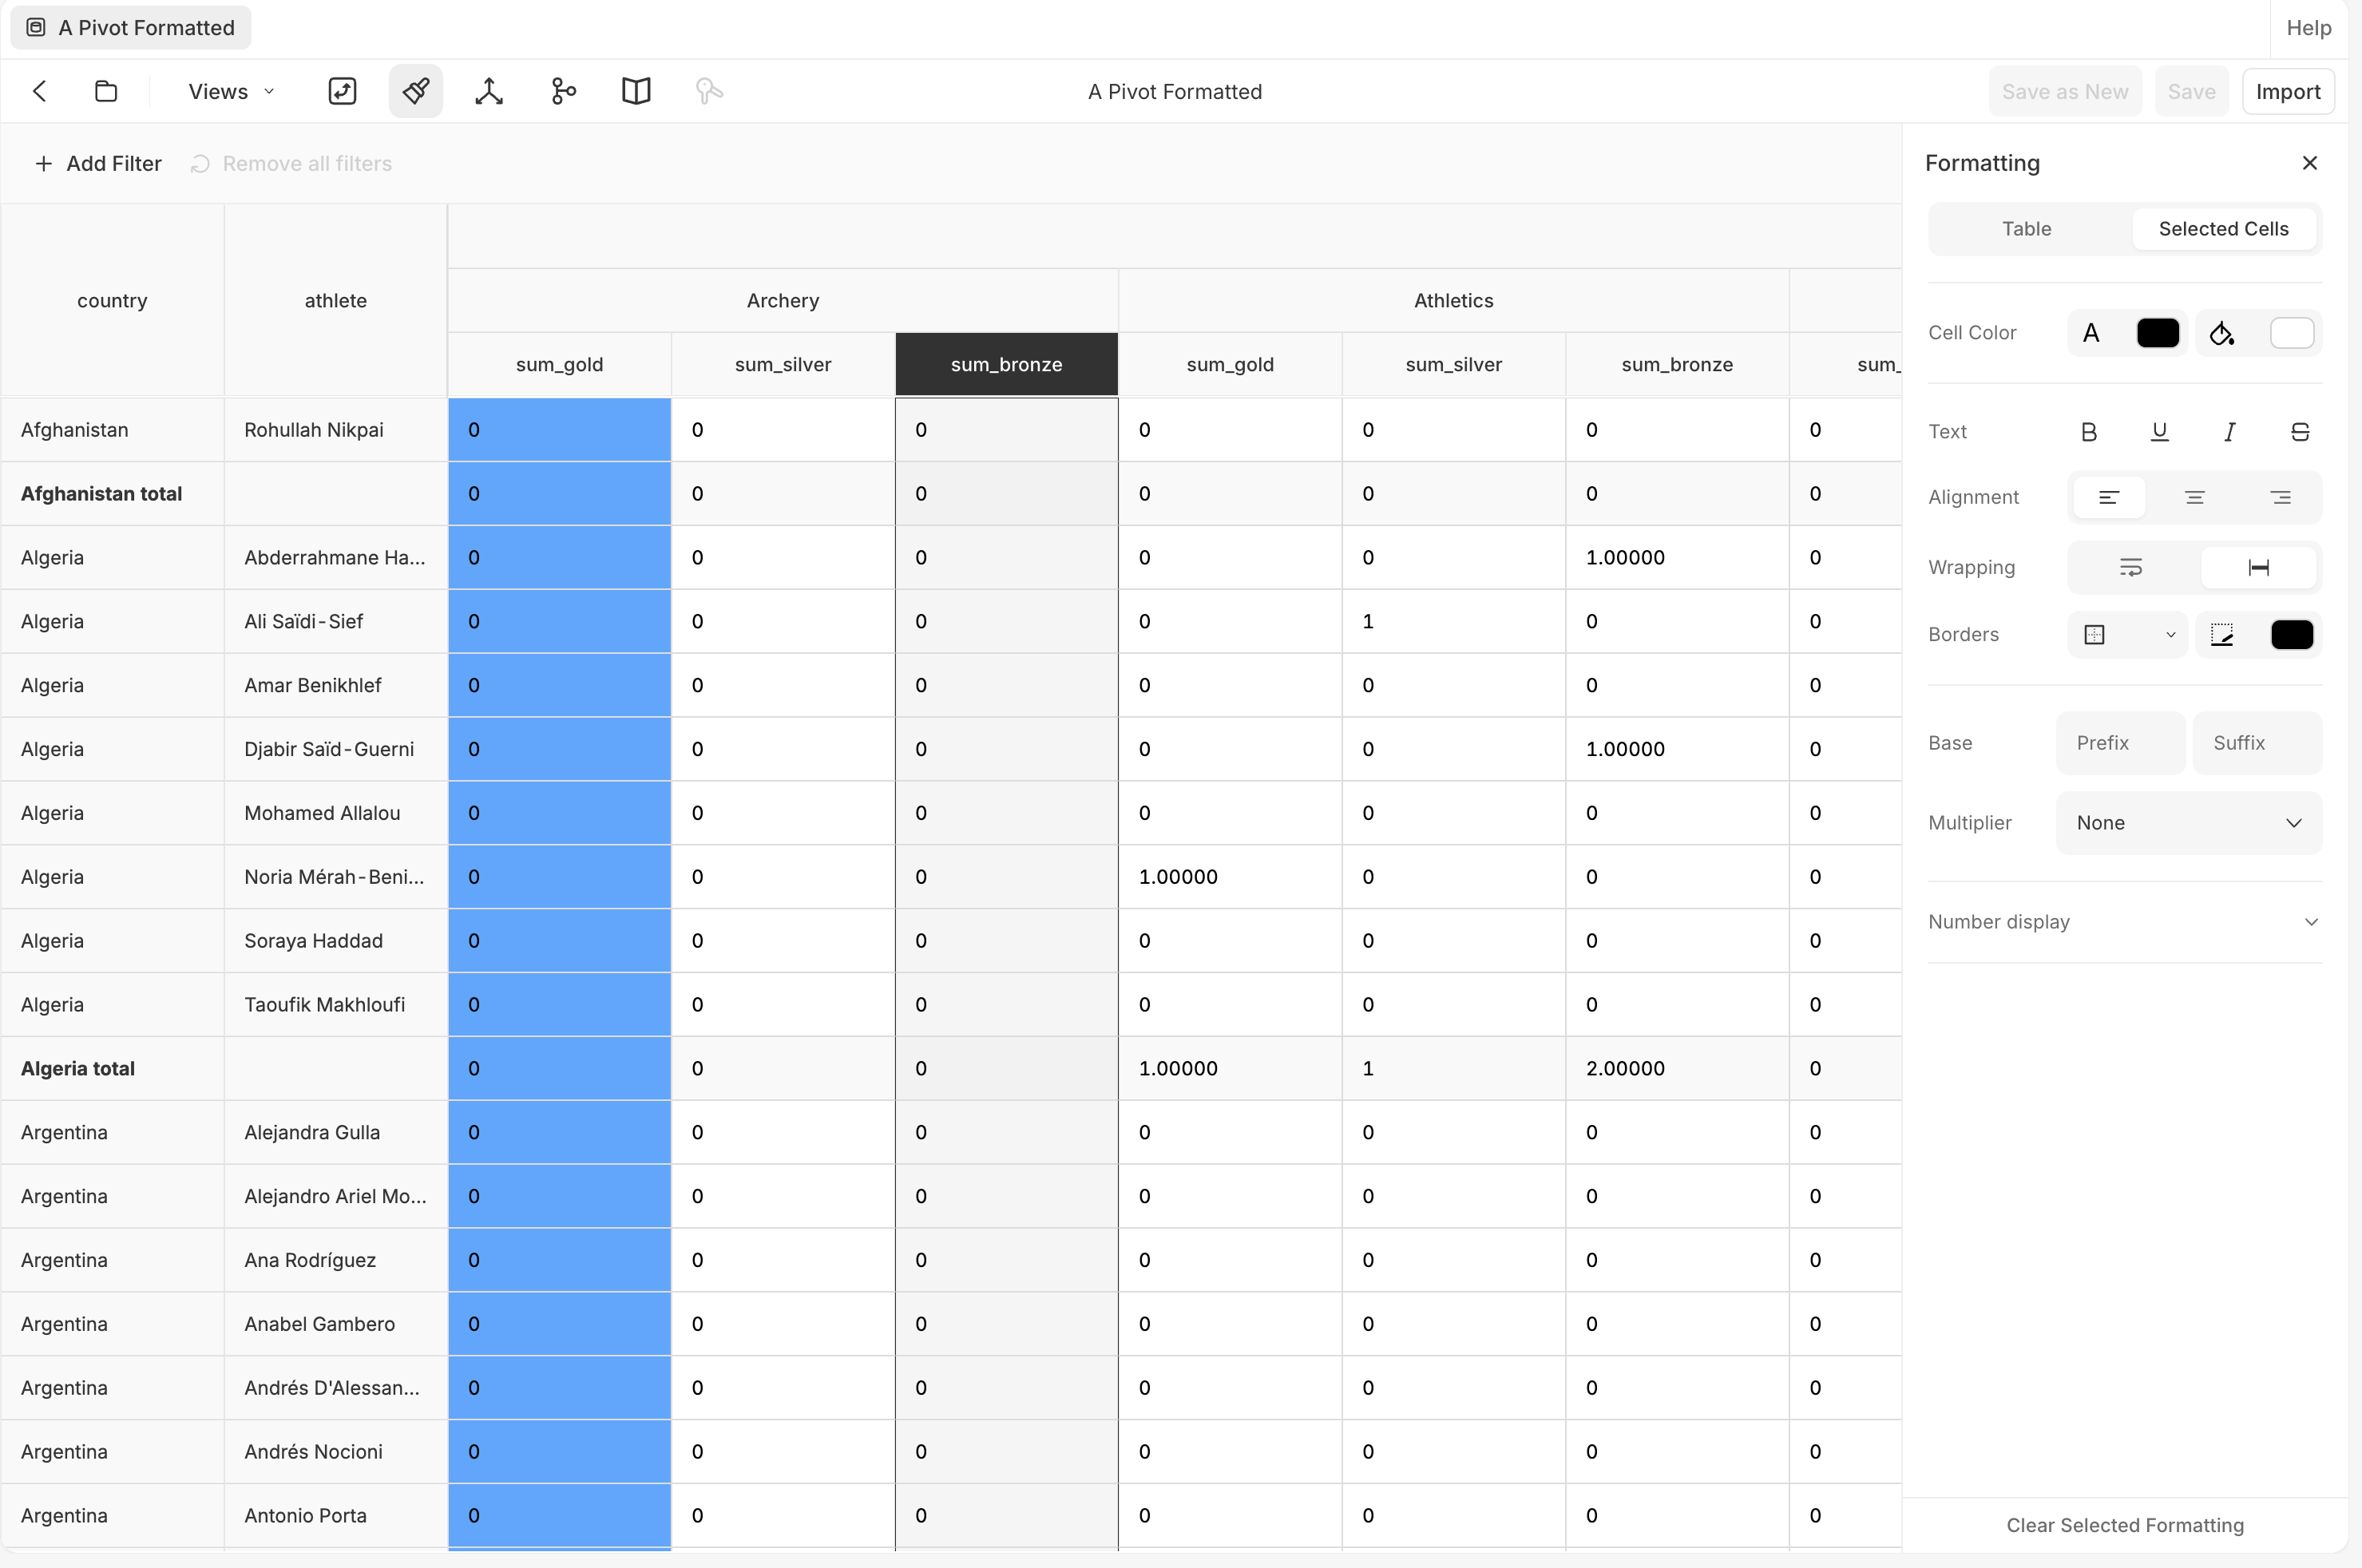
Style a view from the **Formatting** panel (the paintbrush icon in the toolbar). The button is enabled only when a **view** is open, so the raw **Default** table can't be formatted. By default the panel targets the whole **Table** (the **Selected Cells** option is disabled); with the `conditional_formatting` flag on, the target segments become **All**, **Headers**, and **Cells**. Either way the controls are **cell color**, **text** style (bold, underline, italic, strikethrough), **alignment**, **wrapping**, **borders**, a **prefix / suffix**, a **multiplier**, and **number display**.
A view is a lightweight, live slice of one table. When you need a new persisted or joinable dataset, create a [calculation table](/features/tables/calculation) instead.
## Formatting
Style a view from the **Formatting** panel (the paintbrush icon in the toolbar). The button is enabled only when a **view** is open, so the raw **Default** table can't be formatted. By default the panel targets the whole **Table** (the **Selected Cells** option is disabled); with the `conditional_formatting` flag on, the target segments become **All**, **Headers**, and **Cells**. Either way the controls are **cell color**, **text** style (bold, underline, italic, strikethrough), **alignment**, **wrapping**, **borders**, a **prefix / suffix**, a **multiplier**, and **number display**.
 ## Create and manage
Open a table and use the **Views** dropdown in the grid toolbar. **Default** is the raw table; selecting a saved view opens it. Editing the pivot (in the **Pivoting** panel) starts a **draft** (marked "Unsaved changes"), then:
* **Save** — update the current view.
* **Save as New** — promote the draft to a brand-new view.
* **Reset** — discard the draft and return to the parent.
Delete a view from the trash icon on its row in the Views dropdown.
## Create and manage
Open a table and use the **Views** dropdown in the grid toolbar. **Default** is the raw table; selecting a saved view opens it. Editing the pivot (in the **Pivoting** panel) starts a **draft** (marked "Unsaved changes"), then:
* **Save** — update the current view.
* **Save as New** — promote the draft to a brand-new view.
* **Reset** — discard the draft and return to the parent.
Delete a view from the trash icon on its row in the Views dropdown.
 List views (optionally for one table).
Show a view's definition.
Fetch a page of the view's rows.
Delete a view.
Create a view.
## Catalog
Like tables, every view carries a **catalog** (a description, owner, agent-facing description, and per-column descriptions) that Addison reads. See [Catalog](/features/tables#catalog) for what it holds and where to edit it.
Open the **Catalog** panel from the book icon in the view's toolbar, the same as for a table.
Show a view's catalog.
Update a view's catalog (description, owner, agent description).
List views (optionally for one table).
Show a view's definition.
Fetch a page of the view's rows.
Delete a view.
Create a view.
## Catalog
Like tables, every view carries a **catalog** (a description, owner, agent-facing description, and per-column descriptions) that Addison reads. See [Catalog](/features/tables#catalog) for what it holds and where to edit it.
Open the **Catalog** panel from the book icon in the view's toolbar, the same as for a table.
Show a view's catalog.
Update a view's catalog (description, owner, agent description).