> ## Documentation Index
> Fetch the complete documentation index at: https://docs.summation.com/llms.txt
> Use this file to discover all available pages before exploring further.
# Forecast and plan
> Build a forecast, make its assumptions visible, and compare scenarios in an editable Excel model.
Use a forecast to decide what to do next. Build an editable Excel workbook with a base case, alternatives, visible assumptions, and checks that help your team compare choices.
## Choose the data
Use a project containing the historical data, actuals, targets, or existing plan that should anchor the forecast. For a quick trial, upload a spreadsheet. For a model you intend to refresh, use connected data where possible.
If you already have a planning workbook, upload it too. Ask Addison to inspect its formulas and dependencies and preserve the conventions your team relies on.
Need to bring data in first? Follow [Connect your data](/get-started/connect-your-data).
## Ask for a working model
Open the composer, choose the project, and describe the model and its audience:
> Build an Excel forecast for next quarter's gross margin using this project's data. Show a base case, upside case, and downside case. Make revenue growth, product mix, and markdown rate editable assumptions, and flag any missing inputs.
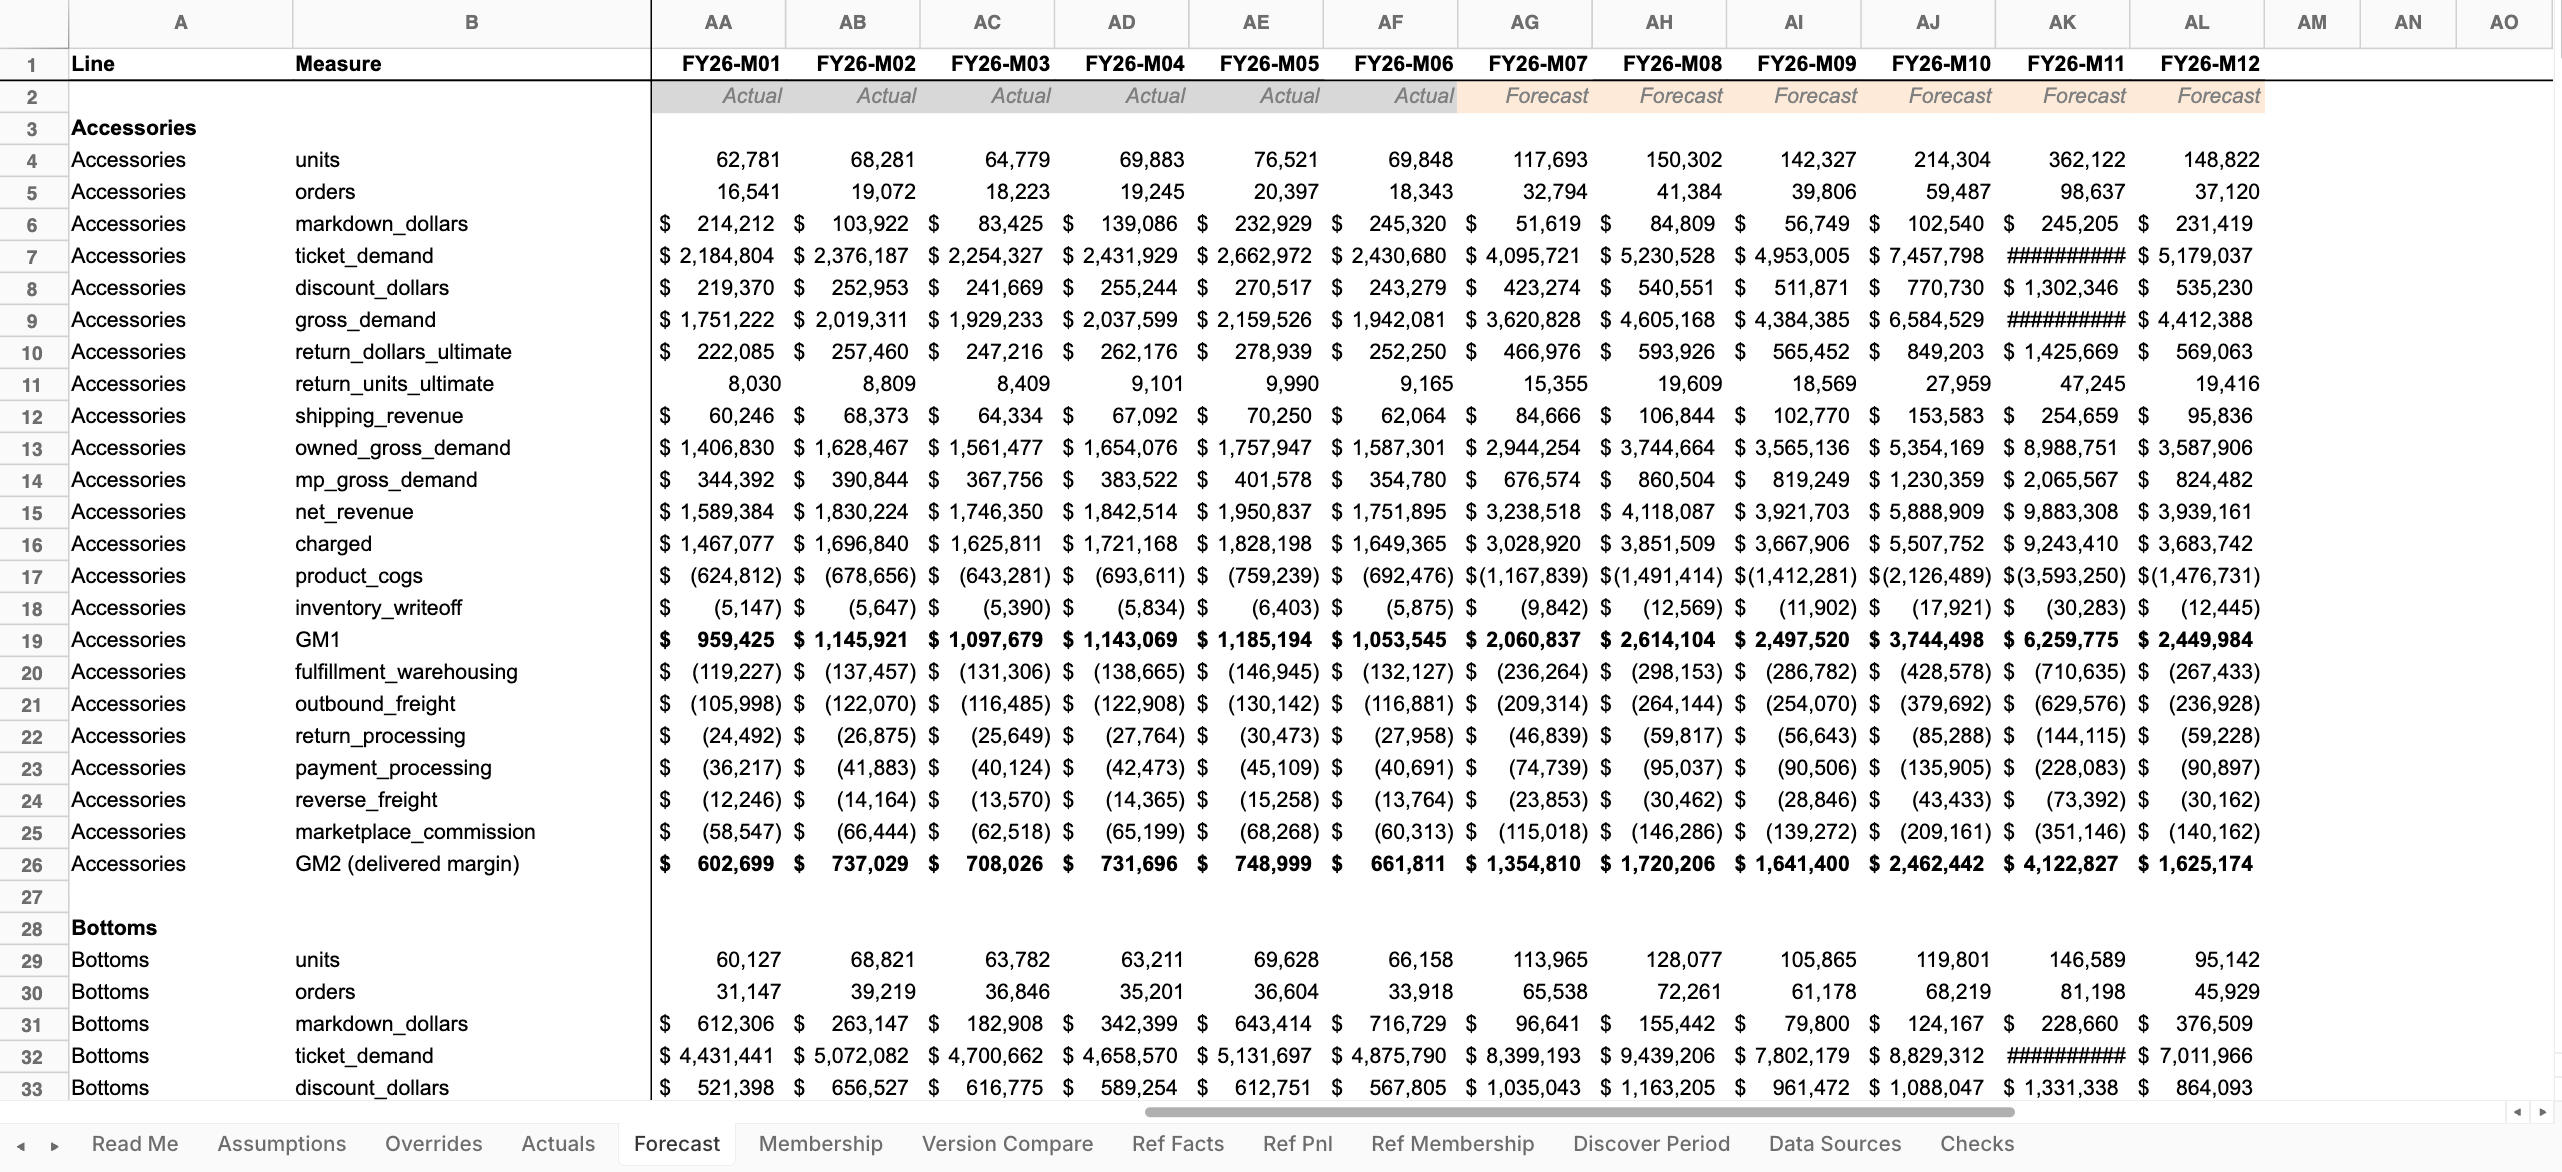
Addison writes the `.xlsx` file into the project. Open it from the file card in the response or from the project's file list.
 ## Refine the model
Check that the model uses the right source period, fiscal calendar, currency, and units. Ask Addison to explain the assumptions and which inputs are missing. You can refine these together once you have a model to inspect.
For example:
> Keep historical actuals separate from planning assumptions, and use formulas so the forecast updates when I change an input.
Before comparing scenarios, make sure you can identify:
| Model element | How to treat it |
| ------------------------ | ------------------------------------------------------------------------- |
| **Historical inputs** | Observed facts tied to a source and an as-of date |
| **Planning assumptions** | User choices, management expectations, or explicit proxies |
| **Calculations** | Formulas that transform the inputs and assumptions |
| **Scenario outputs** | Modeled results, not observed facts |
| **Checks** | Tests that catch broken links, inconsistent totals, or impossible results |
The workbook should not blur these categories. If it does, select the relevant cells and use **Edit with AI** to reorganize or label them.
## Change one assumption
Change one input that matters (for example, markdown rate or revenue growth) and confirm that the scenario outputs recalculate. Then ask:
> Explain which assumptions have the greatest effect on gross margin and where the scenarios begin to change the decision.
The goal is not to generate more scenarios. It is to understand which assumptions carry the decision.
Keep historical actuals fixed when changing scenario assumptions. For an update to an existing model, ask which assumptions changed and how much of the change in the forecast each explains.
## Verify the workbook
Open the **Verification Hub** from the shield in the spreadsheet toolbar and run the available workbook checks. Resolve formula errors, inconsistent outputs, or missing documentation before sharing the model.
## Refine the model
Check that the model uses the right source period, fiscal calendar, currency, and units. Ask Addison to explain the assumptions and which inputs are missing. You can refine these together once you have a model to inspect.
For example:
> Keep historical actuals separate from planning assumptions, and use formulas so the forecast updates when I change an input.
Before comparing scenarios, make sure you can identify:
| Model element | How to treat it |
| ------------------------ | ------------------------------------------------------------------------- |
| **Historical inputs** | Observed facts tied to a source and an as-of date |
| **Planning assumptions** | User choices, management expectations, or explicit proxies |
| **Calculations** | Formulas that transform the inputs and assumptions |
| **Scenario outputs** | Modeled results, not observed facts |
| **Checks** | Tests that catch broken links, inconsistent totals, or impossible results |
The workbook should not blur these categories. If it does, select the relevant cells and use **Edit with AI** to reorganize or label them.
## Change one assumption
Change one input that matters (for example, markdown rate or revenue growth) and confirm that the scenario outputs recalculate. Then ask:
> Explain which assumptions have the greatest effect on gross margin and where the scenarios begin to change the decision.
The goal is not to generate more scenarios. It is to understand which assumptions carry the decision.
Keep historical actuals fixed when changing scenario assumptions. For an update to an existing model, ask which assumptions changed and how much of the change in the forecast each explains.
## Verify the workbook
Open the **Verification Hub** from the shield in the spreadsheet toolbar and run the available workbook checks. Resolve formula errors, inconsistent outputs, or missing documentation before sharing the model.
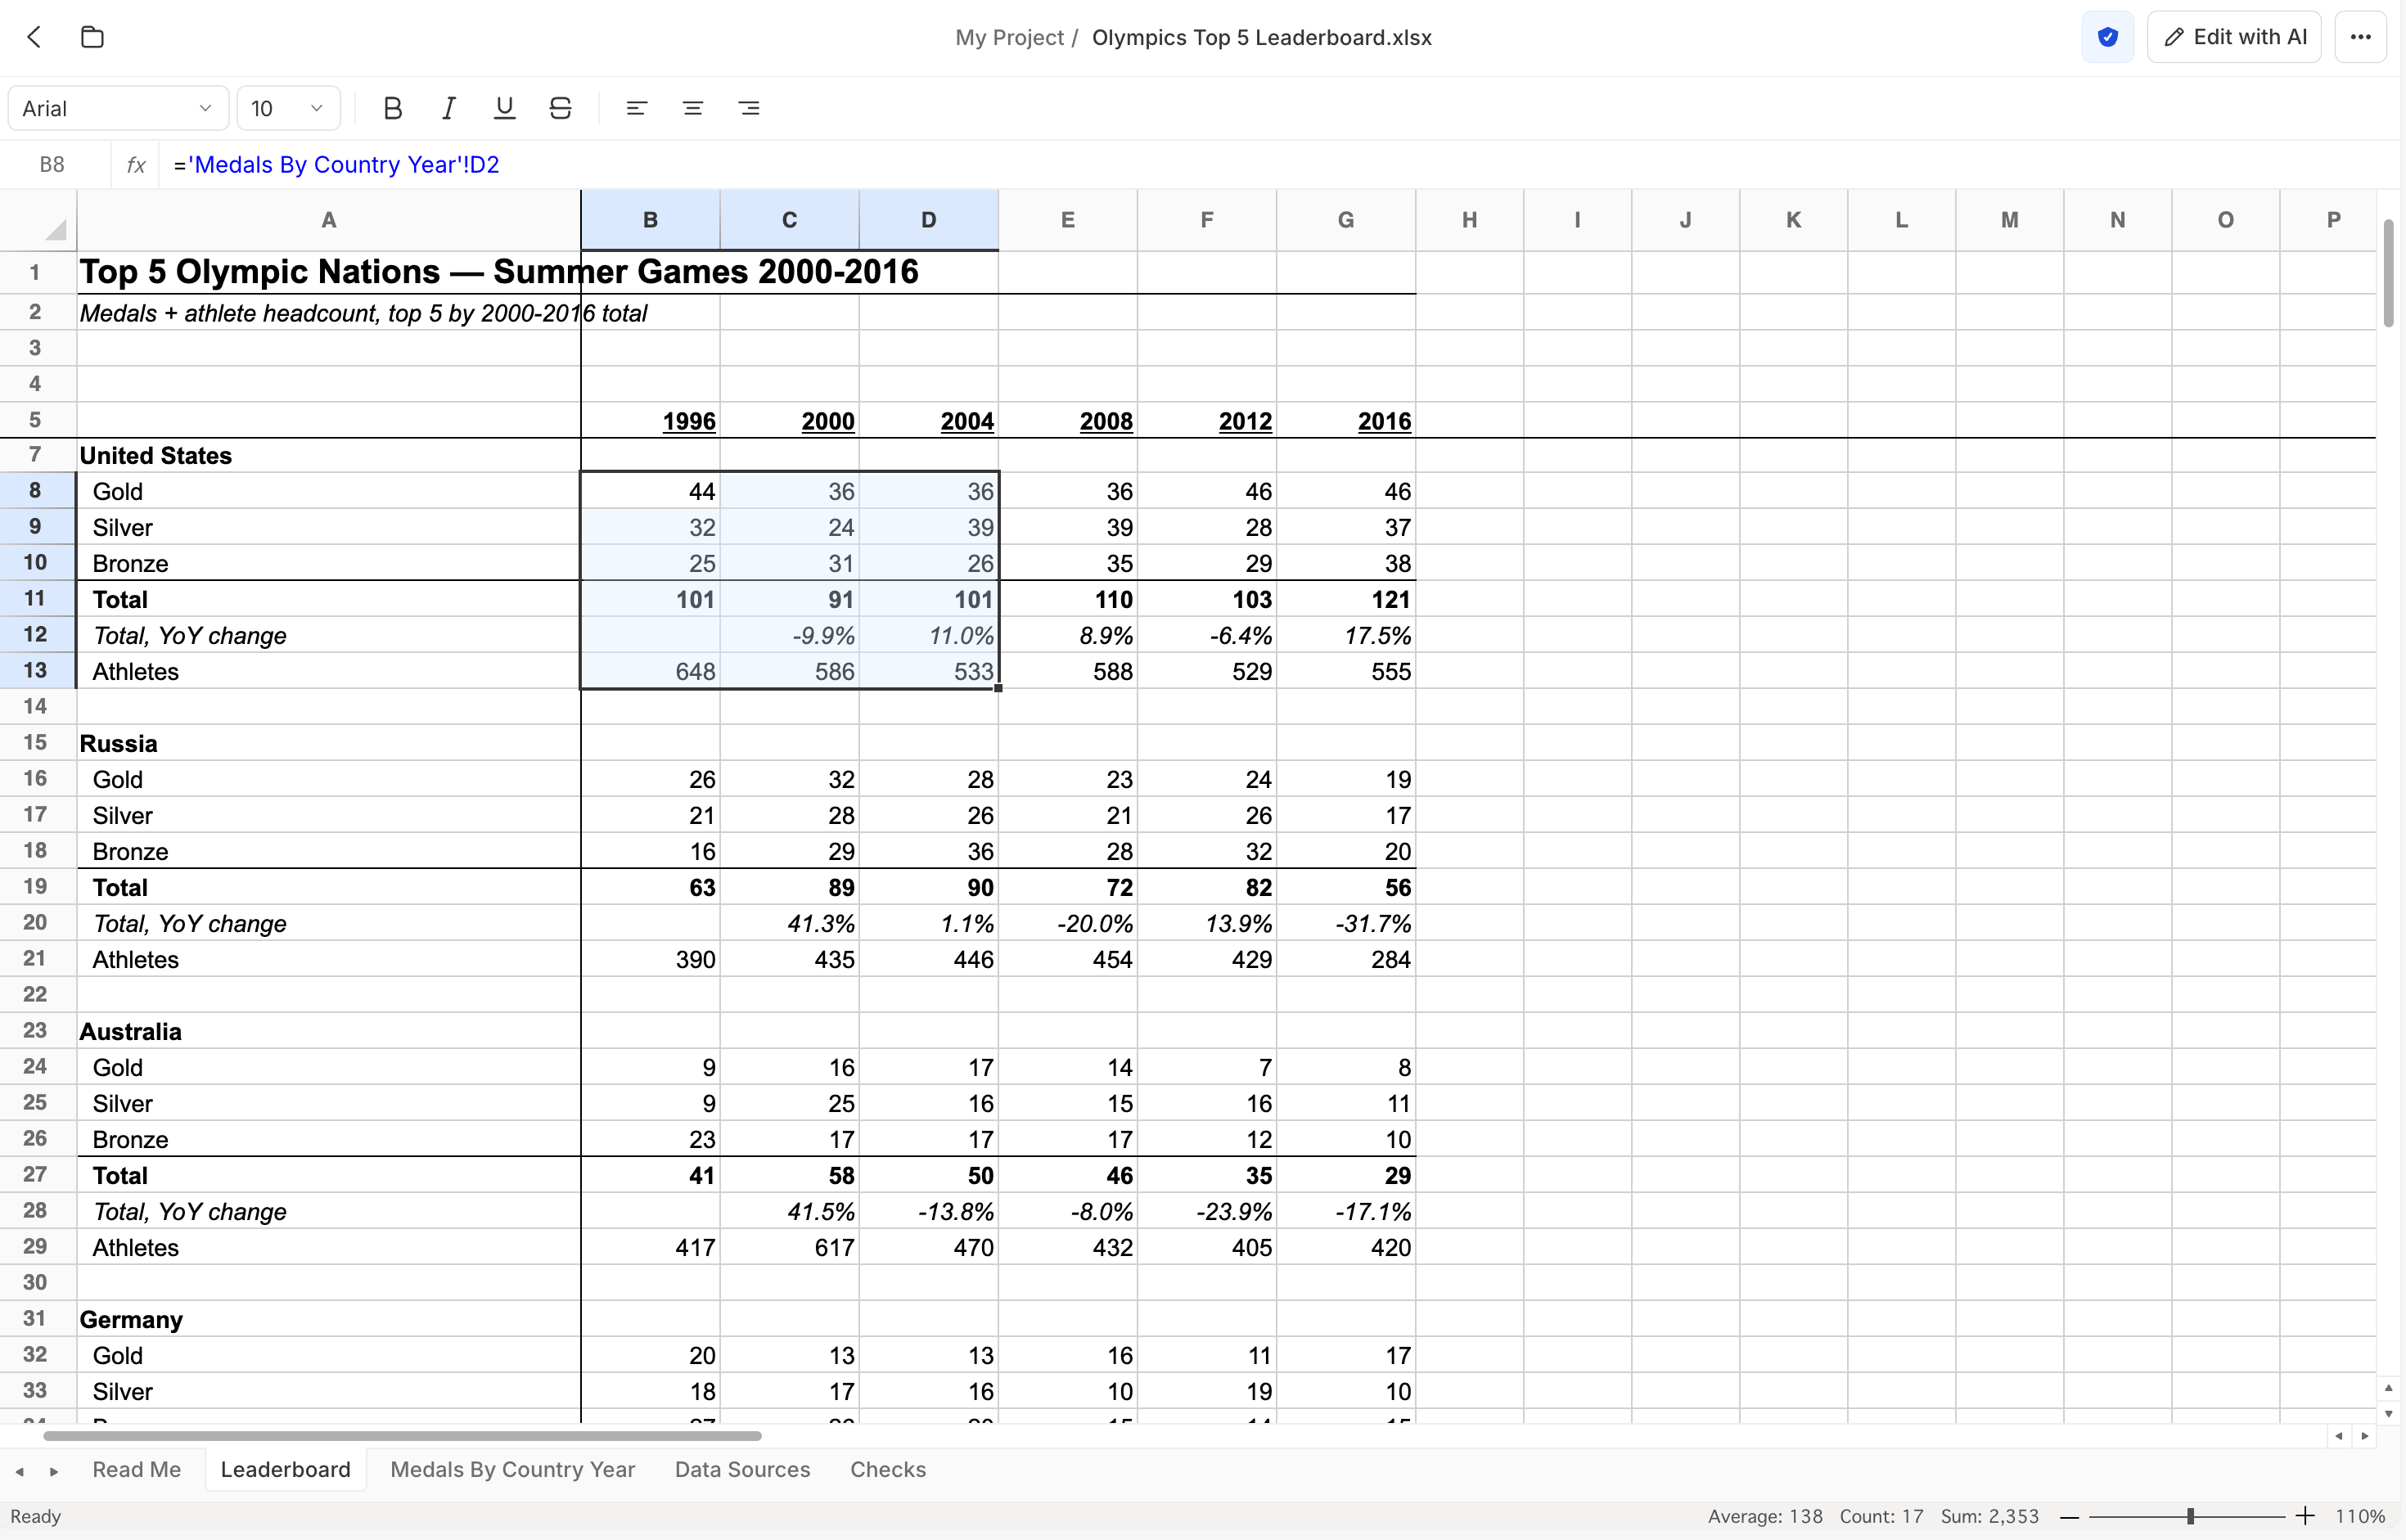 Verification can test the workbook's construction and its relationship to the sources it used. Forecast results still depend on the assumptions you choose. Keep assumptions explicit and review them with the people accountable for the plan.
## Download or share the workbook
Use the **⋯** menu to download the workbook as a standard `.xlsx`. The file retains its formulas so the model remains editable outside Summation.
Open the exported workbook in the spreadsheet application your team uses and change one input to check that the intended outputs recalculate. Review macros, external links, and specialized features separately if your original workbook depends on them. Include the source period, assumption changes, and unresolved questions with the handoff.
Need a shared tool instead of a workbook? Summation can also build a purpose-built [application](/features/applications), available on Enterprise plans. [Contact us](https://www.summation.com/ai-analyst) to set one up; you cannot start it from the Applications page.
## You are done when
You have a model that:
* connects to the right historical evidence;
* separates facts, assumptions, calculations, and outputs;
* compares at least two meaningful scenarios;
* recalculates when an assumption changes;
* contains visible checks and a current verification state;
* can be downloaded as an editable Excel workbook.
## Next
Investigate the historical drivers behind an assumption.
Refresh or deliver the model on a schedule after the logic is stable.
There is no public endpoint that generates an Excel workbook. Ask Addison in a conversation to build the model, then manage the result as a project file. Preserve the provenance boundary among historical facts, user assumptions, external proxies, and modeled outputs. See [Excel](/features/artifacts/excel) and [Applications](/features/applications) for the current product behavior.
Verification can test the workbook's construction and its relationship to the sources it used. Forecast results still depend on the assumptions you choose. Keep assumptions explicit and review them with the people accountable for the plan.
## Download or share the workbook
Use the **⋯** menu to download the workbook as a standard `.xlsx`. The file retains its formulas so the model remains editable outside Summation.
Open the exported workbook in the spreadsheet application your team uses and change one input to check that the intended outputs recalculate. Review macros, external links, and specialized features separately if your original workbook depends on them. Include the source period, assumption changes, and unresolved questions with the handoff.
Need a shared tool instead of a workbook? Summation can also build a purpose-built [application](/features/applications), available on Enterprise plans. [Contact us](https://www.summation.com/ai-analyst) to set one up; you cannot start it from the Applications page.
## You are done when
You have a model that:
* connects to the right historical evidence;
* separates facts, assumptions, calculations, and outputs;
* compares at least two meaningful scenarios;
* recalculates when an assumption changes;
* contains visible checks and a current verification state;
* can be downloaded as an editable Excel workbook.
## Next
Investigate the historical drivers behind an assumption.
Refresh or deliver the model on a schedule after the logic is stable.
There is no public endpoint that generates an Excel workbook. Ask Addison in a conversation to build the model, then manage the result as a project file. Preserve the provenance boundary among historical facts, user assumptions, external proxies, and modeled outputs. See [Excel](/features/artifacts/excel) and [Applications](/features/applications) for the current product behavior.