> ## Documentation Index
> Fetch the complete documentation index at: https://docs.summation.com/llms.txt
> Use this file to discover all available pages before exploring further.
# Get verified insights
> Ask a business question, investigate the answer, and trace the important findings back to their sources.
Start with a question you care about today. Turn the answer into a report, verify it, and inspect the source behind one finding. You will know what passed verification and what still needs judgment.
## Choose your data
For the fastest path, open a [project](/features/projects) and use **+ Import → Upload Files**. Add the spreadsheet, CSV, PDF, or report that contains the evidence for your question.
The file appears in the project's file list and is immediately available to Addison. Use `@` in the composer to attach it to your question when needed.
Choose a project whose catalog already contains the relevant tables or views. Connected data is better when the answer needs to reflect the latest source or become recurring work later.
If the project cannot see the data yet, follow [Connect your data](/get-started/connect-your-data).
## Ask the business question
Open **Home** and choose your project with the grid icon in the composer. Ask the question the way you would ask a colleague who knows the business:
> Which regions grew fastest last quarter, and what drove the change?
Good first questions have a decision or surprise inside them:
* What explains the largest variance from plan?
* Which products are creating the margin decline?
* Where is pipeline risk increasing fastest?
* Which locations improved service without increasing cost?
Avoid packing an entire business review into the first prompt. A focused question makes it easier to assess whether the answer is correct.
## Follow the evidence
Read the first answer and check its reporting period and comparison. If you're asking about a variance from plan, make sure the plan is available; otherwise, ask Addison to use a comparison the data supports.
Choose a finding you want to understand better and ask a follow-up in the same thread:
> Break that down by channel.
> Which drivers explain most of the change?
> What does the data support directly, and what are you inferring?
The thread keeps the original question and its context, so you can refine the analysis without starting over.
## Save the answer as a report
When the analysis answers the question, ask:
> Turn this into a concise report for an operating review. Preserve the reasoning and cite every material figure and claim.
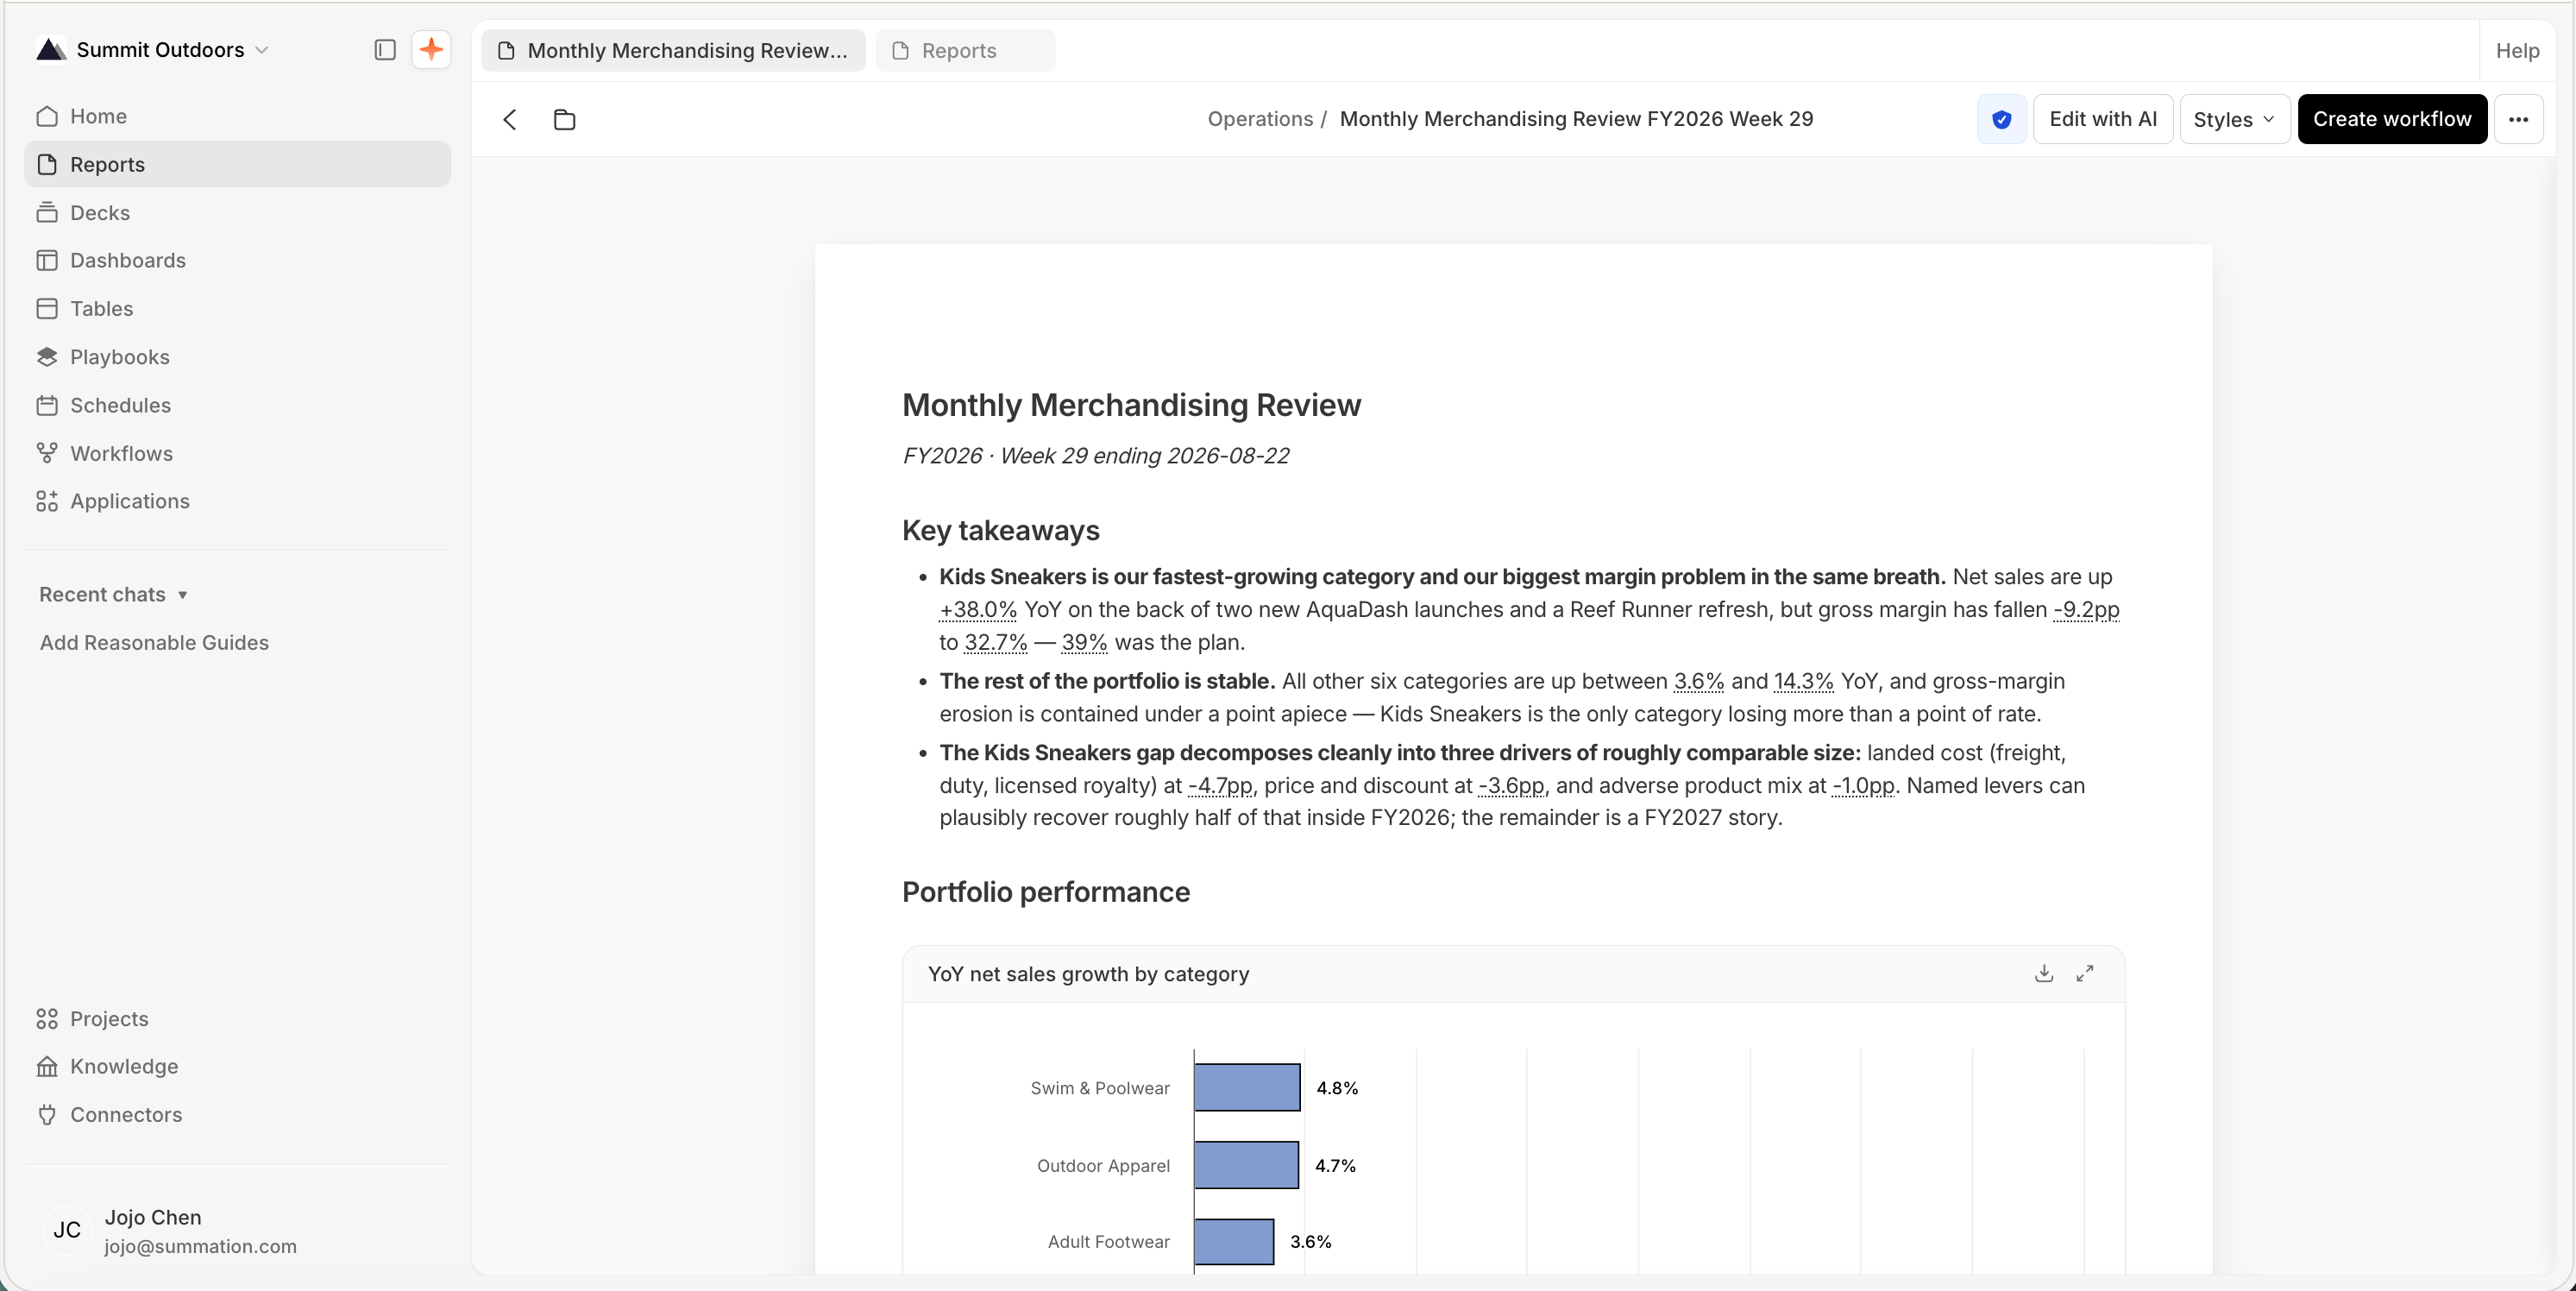
The report arrives as a card in Addison's response. Select **Open** to review it. The report lives in the project, where you can share it, edit it, download it, or use it again later.
 ## Verify the result
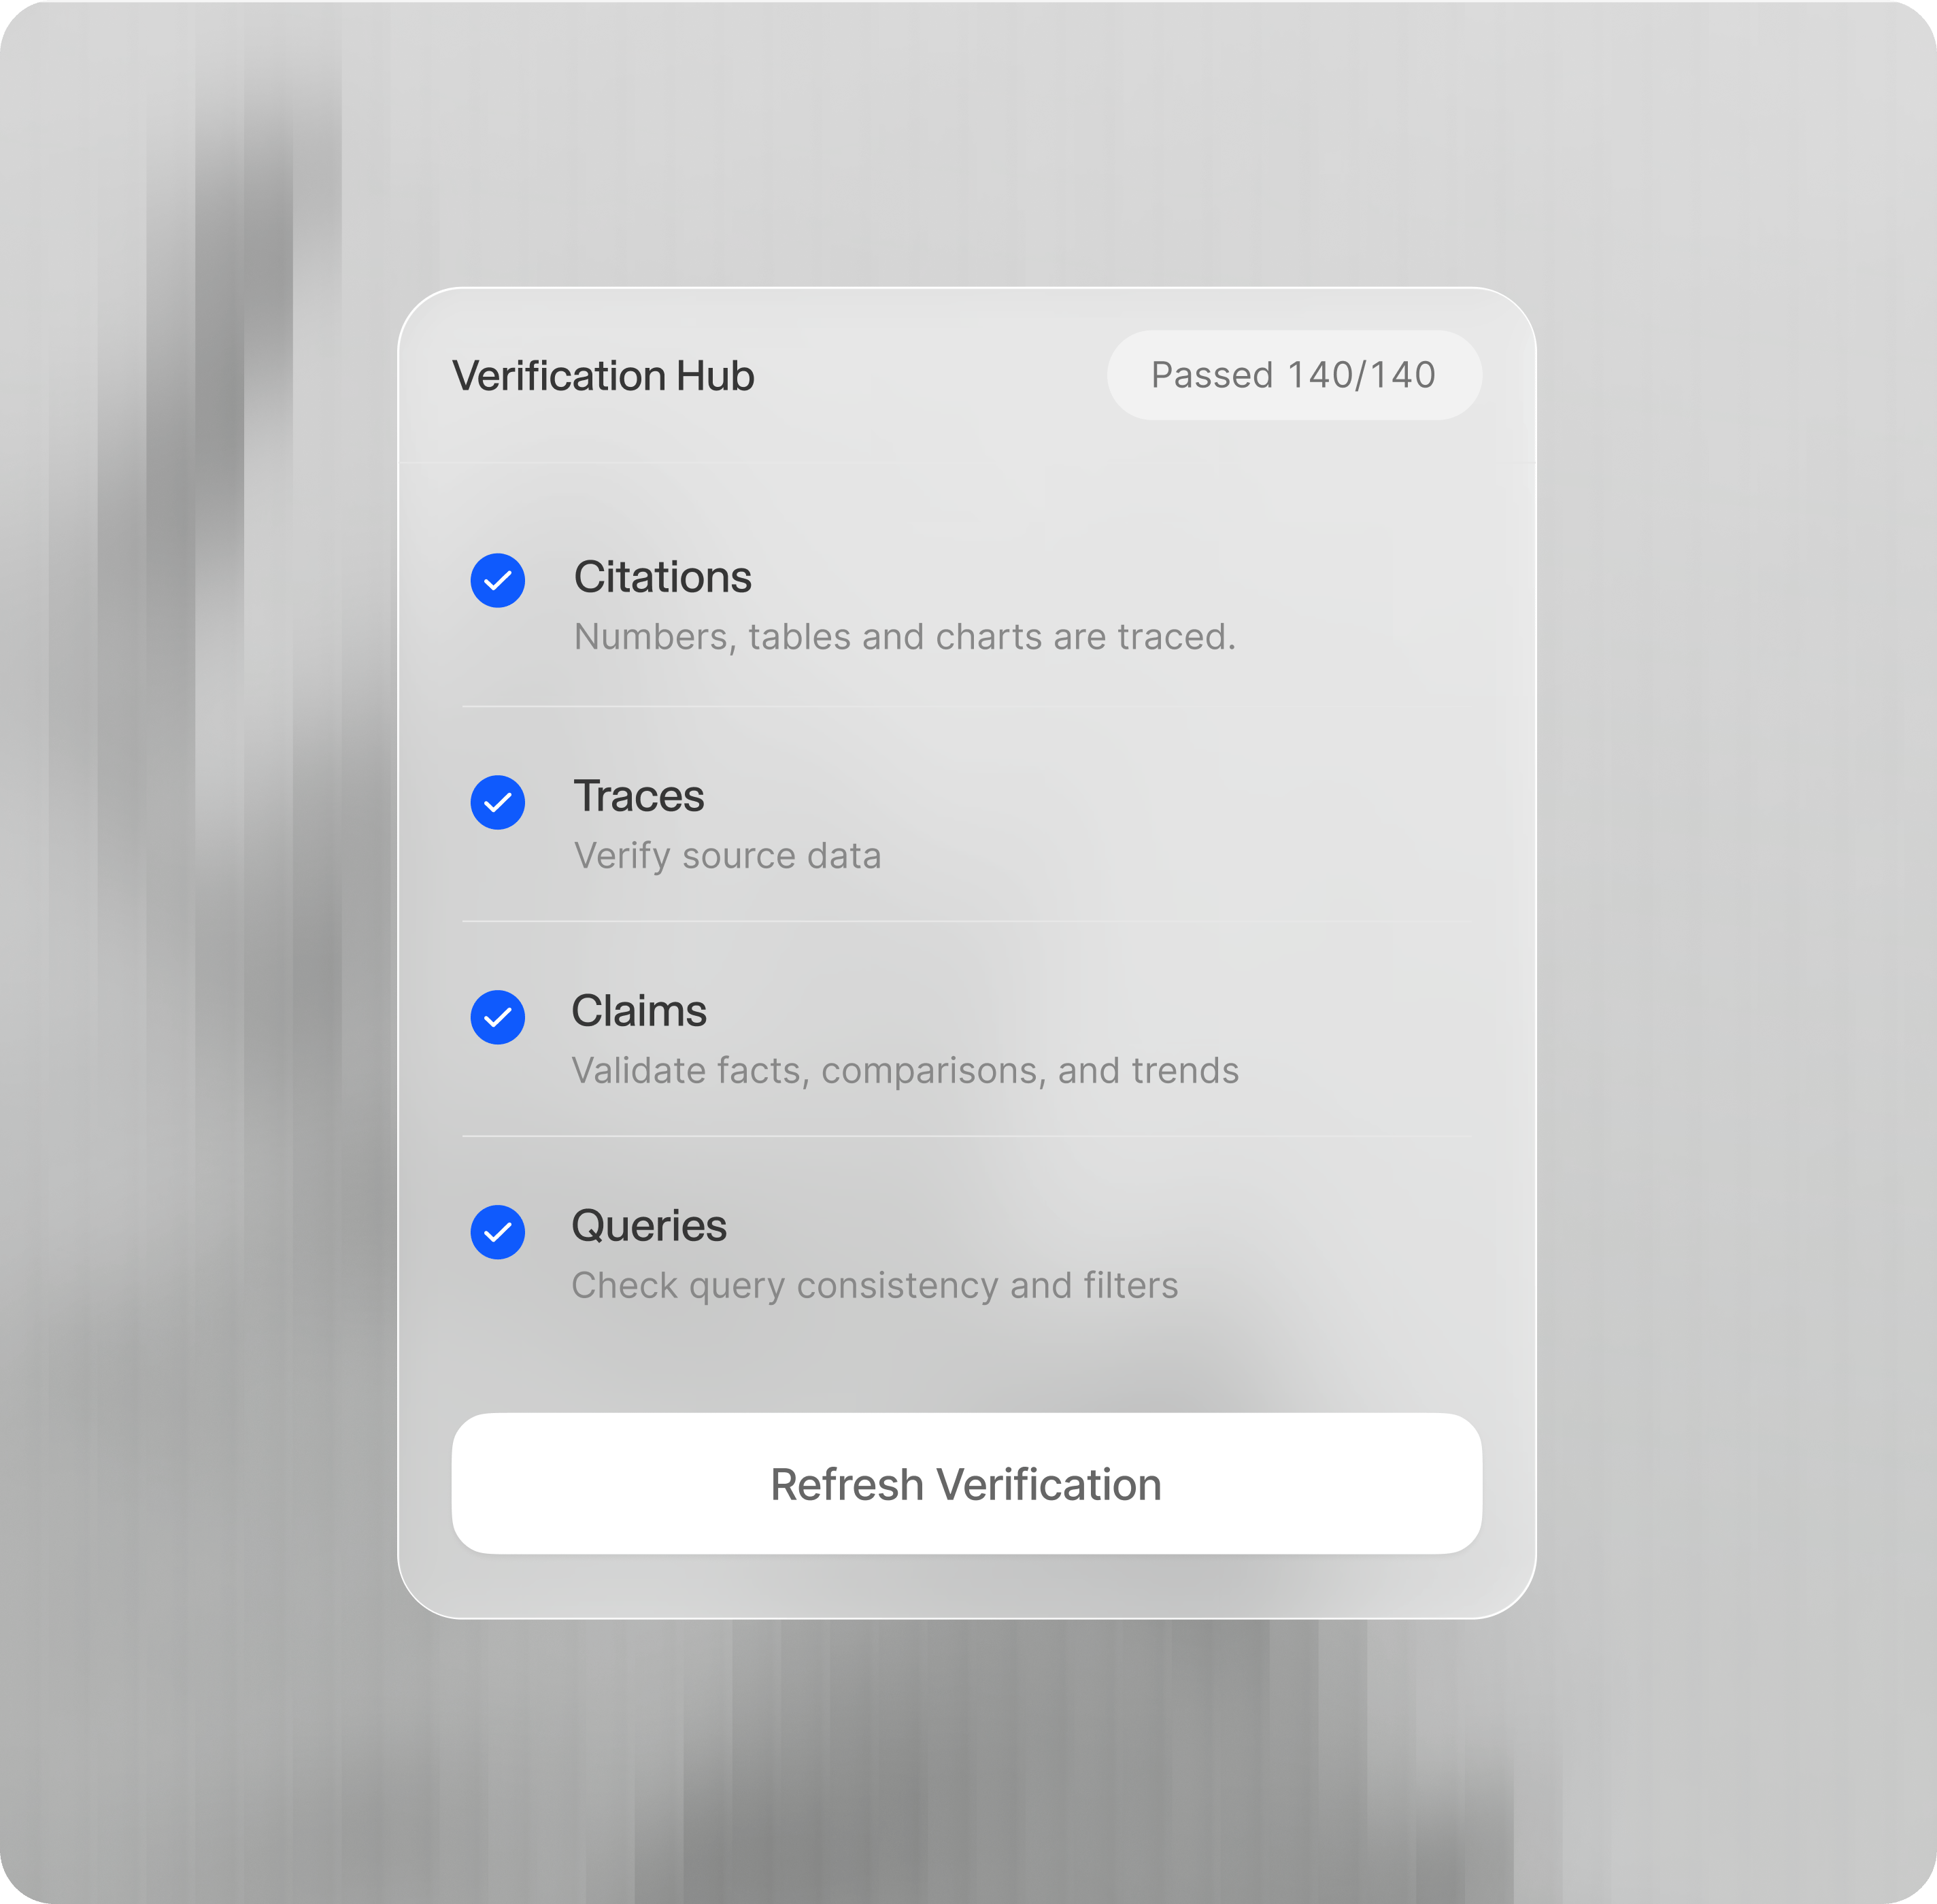
Click the **verification badge** in the report toolbar and choose **Verify**. The Verification Hub checks four dimensions:
| Check | What it establishes |
| --------------------- | --------------------------------------------------- |
| **Citation accuracy** | Cited values agree with the source data behind them |
| **Traceability** | Numbers, tables, and charts resolve to a source |
| **Claim accuracy** | Factual statements and comparisons are supported |
| **Query accuracy** | Queries and filters are internally consistent |
Wait for the toolbar badge to show the current result:
* **Verified** means the checks passed.
* **Failed** means verification found blocking issues. Advisory findings can still need review without changing the pass/fail status.
* **Stale** means the report changed after its last verification.
* **Unverified** means verification has not been run.
* **In progress** means the checks are still running.
* **Error** means verification could not finish; inspect the run error before retrying.
## Verify the result
Click the **verification badge** in the report toolbar and choose **Verify**. The Verification Hub checks four dimensions:
| Check | What it establishes |
| --------------------- | --------------------------------------------------- |
| **Citation accuracy** | Cited values agree with the source data behind them |
| **Traceability** | Numbers, tables, and charts resolve to a source |
| **Claim accuracy** | Factual statements and comparisons are supported |
| **Query accuracy** | Queries and filters are internally consistent |
Wait for the toolbar badge to show the current result:
* **Verified** means the checks passed.
* **Failed** means verification found blocking issues. Advisory findings can still need review without changing the pass/fail status.
* **Stale** means the report changed after its last verification.
* **Unverified** means verification has not been run.
* **In progress** means the checks are still running.
* **Error** means verification could not finish; inspect the run error before retrying.
 Verification checks the report against the sources it used. It does not turn an outdated upload into current data or resolve a business definition that was never supplied.
## Trace one finding yourself
Choose the most surprising figure in the report. Cited values are underlined; click one to open its **Value trace**. Confirm:
Verification checks the report against the sources it used. It does not turn an outdated upload into current data or resolve a business definition that was never supplied.
## Trace one finding yourself
Choose the most surprising figure in the report. Cited values are underlined; click one to open its **Value trace**. Confirm:
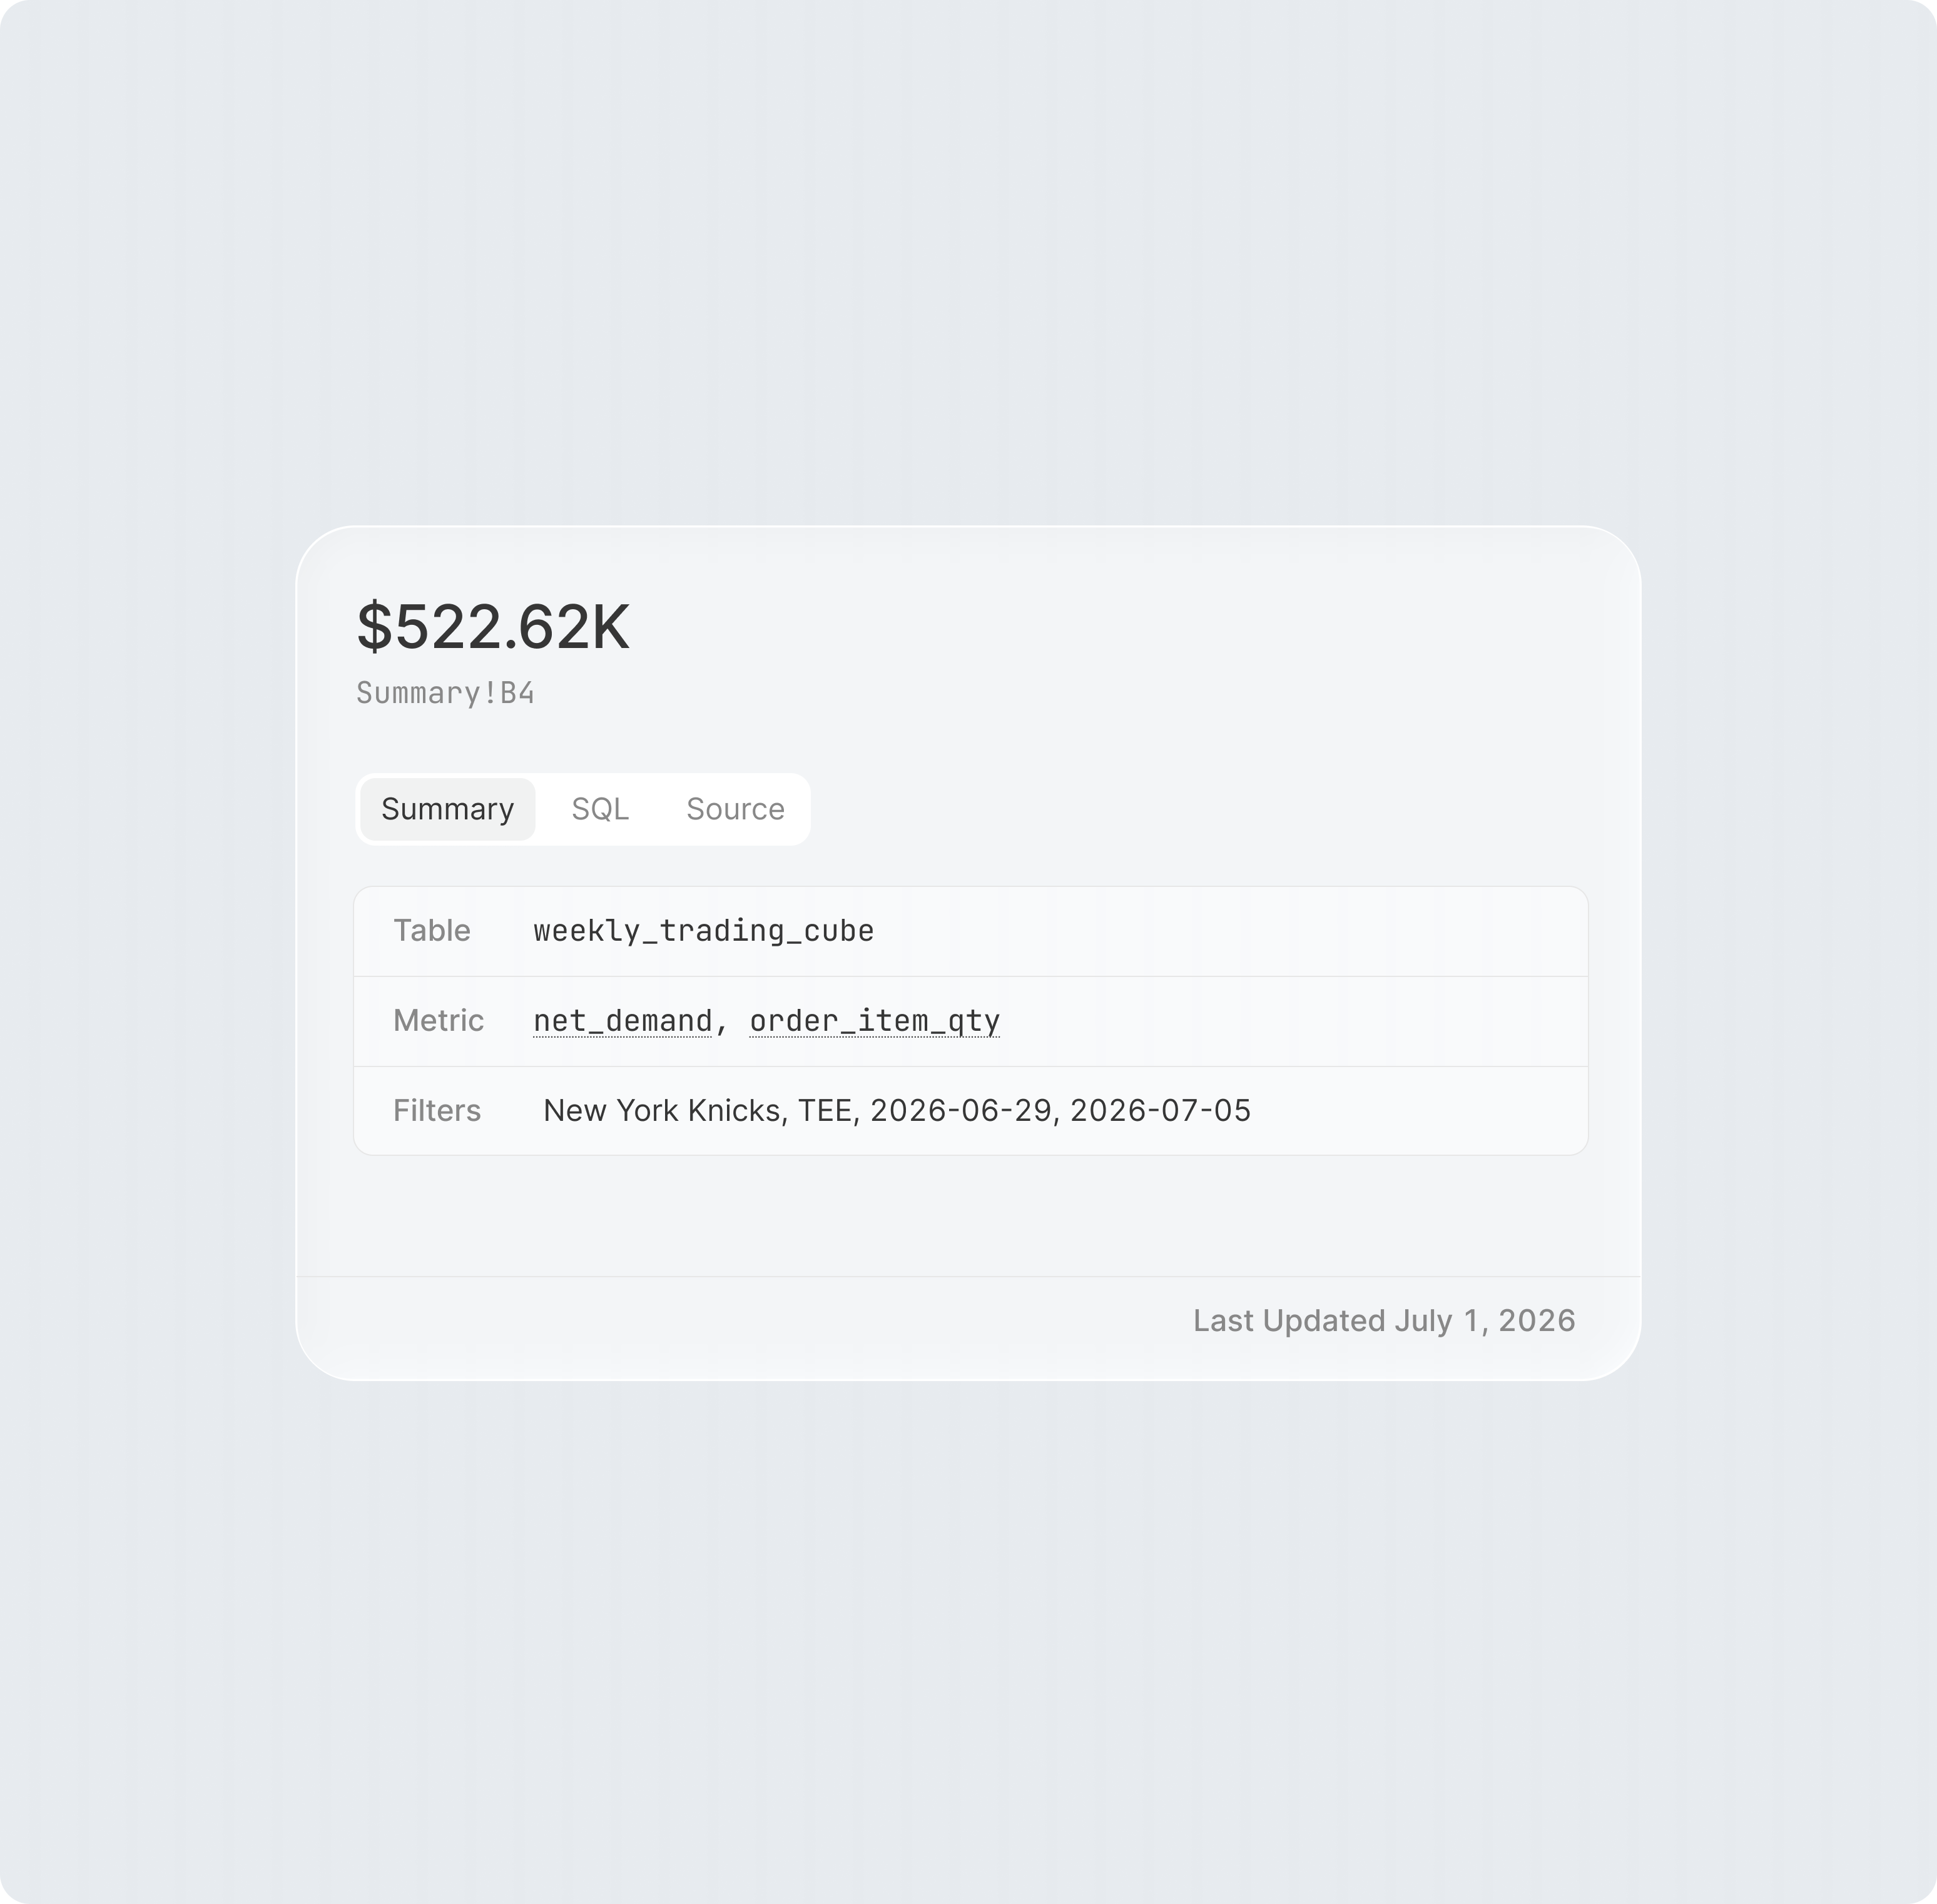 * the query result contains the expected comparison;
* the highlighted value supports the number in the report;
* the source is current enough for the decision.
You do not need to recheck every number. Trace one surprising figure so you understand the result and can answer when someone asks, "Where did that come from?"
## Add the business definition that is missing
If the analysis is technically consistent but wrong about your business, correct it in the same thread:
> For this analysis, revenue means net revenue after refunds, and the fiscal quarter starts in February. Update the report and remember those definitions for this project.
After an edit, run verification again. The badge remains **Stale** until the current version has been checked.
## You are done when
You have a report that answers your question, a current verification result you've reviewed, and a finding you can trace to its source. Keep any remaining limitations visible when you share it.
## If the result needs work
If a total disagrees with a trusted source, compare the reporting period, units, definitions, filters, and joins before editing the narrative. If verification fails, inspect the failing check, correct the underlying issue, and verify the new version. A confident explanation still needs evidence; ask Addison to separate measured contributors from possible causes.
## Next
Turn the investigation into a pulse that surfaces new changes.
Use the evidence as the starting point for scenarios and a working model.
For agent-led work, use the person's existing file or project when possible, ask the question through Addison rather than hand-authoring SQL, and run report verification before calling the work complete. Read the **API** tabs on [Addison](/features/addison) and [Reports](/features/artifacts/reports) for the current agent surface.
* the query result contains the expected comparison;
* the highlighted value supports the number in the report;
* the source is current enough for the decision.
You do not need to recheck every number. Trace one surprising figure so you understand the result and can answer when someone asks, "Where did that come from?"
## Add the business definition that is missing
If the analysis is technically consistent but wrong about your business, correct it in the same thread:
> For this analysis, revenue means net revenue after refunds, and the fiscal quarter starts in February. Update the report and remember those definitions for this project.
After an edit, run verification again. The badge remains **Stale** until the current version has been checked.
## You are done when
You have a report that answers your question, a current verification result you've reviewed, and a finding you can trace to its source. Keep any remaining limitations visible when you share it.
## If the result needs work
If a total disagrees with a trusted source, compare the reporting period, units, definitions, filters, and joins before editing the narrative. If verification fails, inspect the failing check, correct the underlying issue, and verify the new version. A confident explanation still needs evidence; ask Addison to separate measured contributors from possible causes.
## Next
Turn the investigation into a pulse that surfaces new changes.
Use the evidence as the starting point for scenarios and a working model.
For agent-led work, use the person's existing file or project when possible, ask the question through Addison rather than hand-authoring SQL, and run report verification before calling the work complete. Read the **API** tabs on [Addison](/features/addison) and [Reports](/features/artifacts/reports) for the current agent surface.