> ## Documentation Index
> Fetch the complete documentation index at: https://docs.summation.com/llms.txt
> Use this file to discover all available pages before exploring further.
# Catch anomalies before the review does
> A weekly report that flags the biggest changes, keeps ongoing issues visible, and tells you what it could not check.
Output
[Report](/features/artifacts/reports) and scheduled [workflow](/features/workflows)
Cadence
Weekly
For
COOs and VPs of Operations, merchandising and category managers, revenue and growth leads, ops analysts
## When to use it
Most problems start before the weekly review catches them. Summation checks the data every week and sends the few changes worth acting on. It keeps open issues visible and tells you when data is missing, so a quiet report means nothing changed, not that the check failed.
## Understanding the demo
When you delegate a monitor to Summation, you get a short report every week in the same order, whether or not anything happened.
The report starts with the changes worth a look, ranked by financial impact and limited to what your team can actually follow up on. Ongoing issues stay there until they are resolved. It also shows what could not be checked and includes zeroes, so you can tell the difference between a quiet week and a failed run.
 1. **Changes this week:** Findings ranked by margin impact, each with a clear follow-up. If nothing changed, the report says so
2. **Ongoing issues:** Step changes stay visible with their cumulative cost until resolved
3. **What is still unknown:** Possible causes the data cannot confirm, plus who can investigate
4. **What could not be checked:** Questions the available data cannot answer, routed to the right team
5. **Counts:** Totals for flagged, clean, ongoing, ineligible, and unanswerable cases
6. **Method:** How the monitor was calibrated and tested for each run
Every number links to its source query. Summation checks [the data, math, and findings](/features/artifacts/verification) before delivery.
## How it works
Before the first run, you choose what to watch and what counts as important:
1. **Check the data:** [Addison](/features/addison) looks at what is available, how each metric is calculated, and whether the data is current
2. **Set the watch list:** You decide which direction is bad and how many issues your team can handle each week
3. **Test the settings:** The monitor runs against your history, so you can see how often it would have alerted before you choose a threshold
4. **Build and verify:** Summation checks freshness, groups related changes, and writes the report, then [verifies](/features/artifacts/verification) it before anything is sent: cited figures against their source queries, and each finding against the data behind it
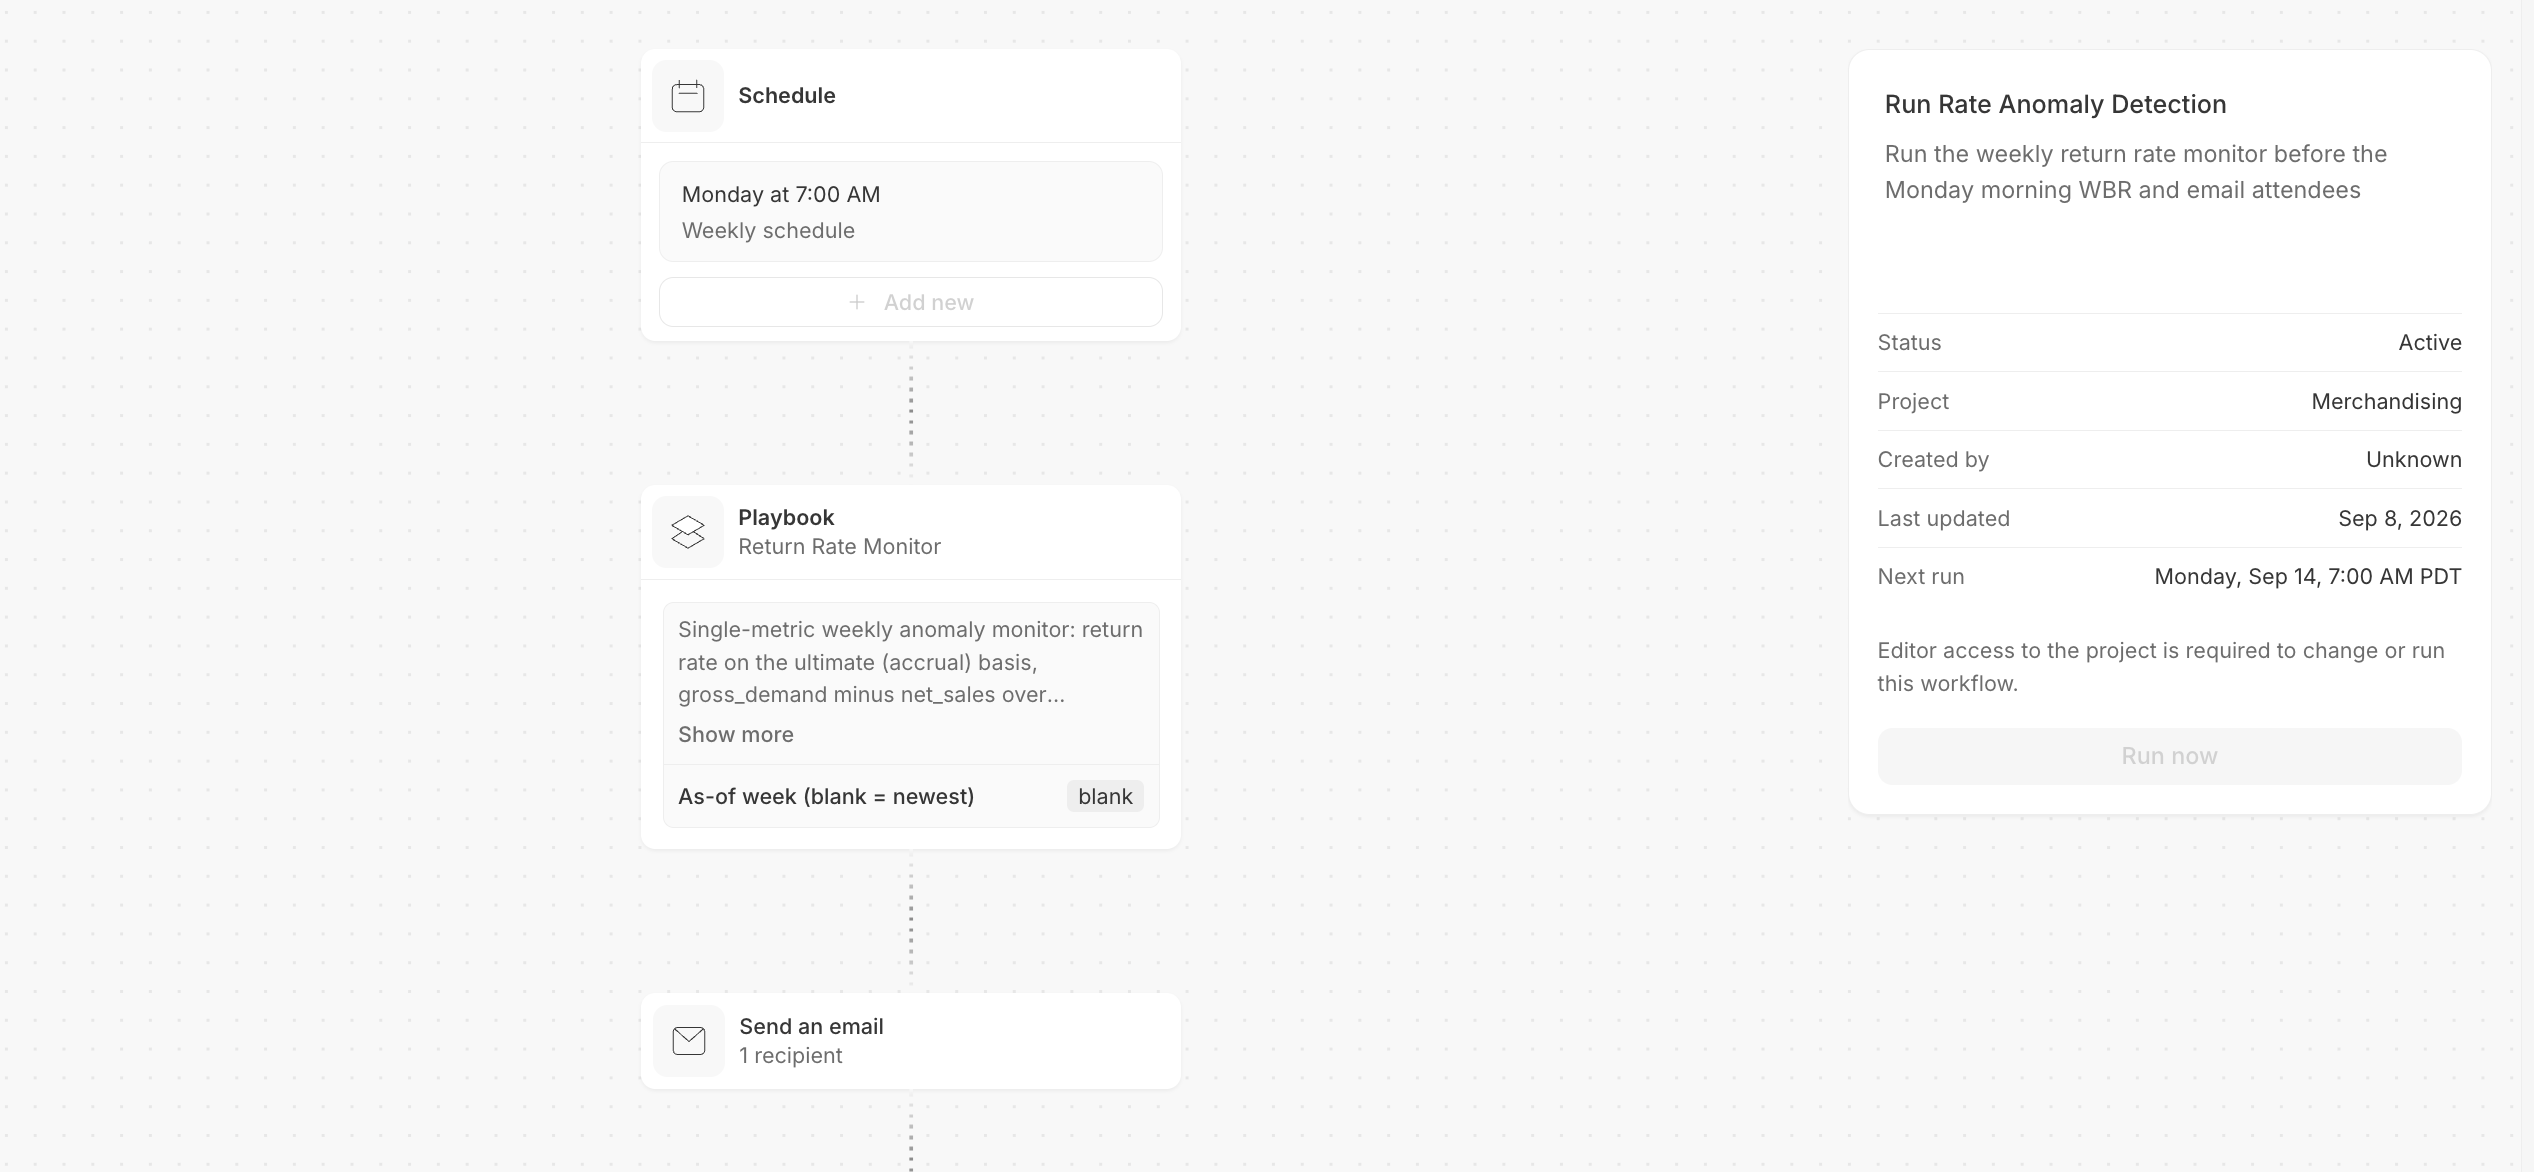
5. **Run it each week:** Save it as a [Playbook](/features/artifacts/playbooks) and schedule it weekly, and every run repeats the same checks on that week's data
## What you need
| Data | Required? | What it adds |
| ----------------------------------------------- | --------- | -------------------------------------------------------- |
| **Transactions at the level you want to watch** | Yes | The metric and how it is calculated |
| **One full seasonal cycle of history** | Optional | Lets the report call a movement an anomaly |
| **Margin or cost** | Optional | Ranks findings by dollars. Without it, they rank by size |
| **Promo or launch calendar** | Optional | Keeps expected events from being flagged |
| **Known past events** | Optional | Tests the detection before it goes live |
Connect your [warehouse](/features/connectors) to run the monitor on fresh data each week. You can also upload a file for the first run.
## Make it yours
Change the metric, level, floor, or cap in the Playbook. Name a past event to test the monitor against it. Set a period to replay an earlier week. Ask Addison to remember corrections for future runs.
## Try it
**In Summation:**
* **Use the setup skill:** `/anomaly-detection`
* **Or follow the guided setup:** Get started → Choose a ready-made job → **Catch unusual changes early** → Explore demo → **Create with my data**
**From another agent:** Open [summation.com/agents.md](https://summation.com/agents.md) and ask for weekly anomaly detection on a named metric.
## Next
How a report is built, cited, and edited.
How Summation checks accuracy before you share.
Save the instructions so a run repeats exactly.
Add a schedule and deliver by email or Slack.
1. **Changes this week:** Findings ranked by margin impact, each with a clear follow-up. If nothing changed, the report says so
2. **Ongoing issues:** Step changes stay visible with their cumulative cost until resolved
3. **What is still unknown:** Possible causes the data cannot confirm, plus who can investigate
4. **What could not be checked:** Questions the available data cannot answer, routed to the right team
5. **Counts:** Totals for flagged, clean, ongoing, ineligible, and unanswerable cases
6. **Method:** How the monitor was calibrated and tested for each run
Every number links to its source query. Summation checks [the data, math, and findings](/features/artifacts/verification) before delivery.
## How it works
Before the first run, you choose what to watch and what counts as important:
1. **Check the data:** [Addison](/features/addison) looks at what is available, how each metric is calculated, and whether the data is current
2. **Set the watch list:** You decide which direction is bad and how many issues your team can handle each week
3. **Test the settings:** The monitor runs against your history, so you can see how often it would have alerted before you choose a threshold
4. **Build and verify:** Summation checks freshness, groups related changes, and writes the report, then [verifies](/features/artifacts/verification) it before anything is sent: cited figures against their source queries, and each finding against the data behind it
5. **Run it each week:** Save it as a [Playbook](/features/artifacts/playbooks) and schedule it weekly, and every run repeats the same checks on that week's data
## What you need
| Data | Required? | What it adds |
| ----------------------------------------------- | --------- | -------------------------------------------------------- |
| **Transactions at the level you want to watch** | Yes | The metric and how it is calculated |
| **One full seasonal cycle of history** | Optional | Lets the report call a movement an anomaly |
| **Margin or cost** | Optional | Ranks findings by dollars. Without it, they rank by size |
| **Promo or launch calendar** | Optional | Keeps expected events from being flagged |
| **Known past events** | Optional | Tests the detection before it goes live |
Connect your [warehouse](/features/connectors) to run the monitor on fresh data each week. You can also upload a file for the first run.
## Make it yours
Change the metric, level, floor, or cap in the Playbook. Name a past event to test the monitor against it. Set a period to replay an earlier week. Ask Addison to remember corrections for future runs.
## Try it
**In Summation:**
* **Use the setup skill:** `/anomaly-detection`
* **Or follow the guided setup:** Get started → Choose a ready-made job → **Catch unusual changes early** → Explore demo → **Create with my data**
**From another agent:** Open [summation.com/agents.md](https://summation.com/agents.md) and ask for weekly anomaly detection on a named metric.
## Next
How a report is built, cited, and edited.
How Summation checks accuracy before you share.
Save the instructions so a run repeats exactly.
Add a schedule and deliver by email or Slack.