
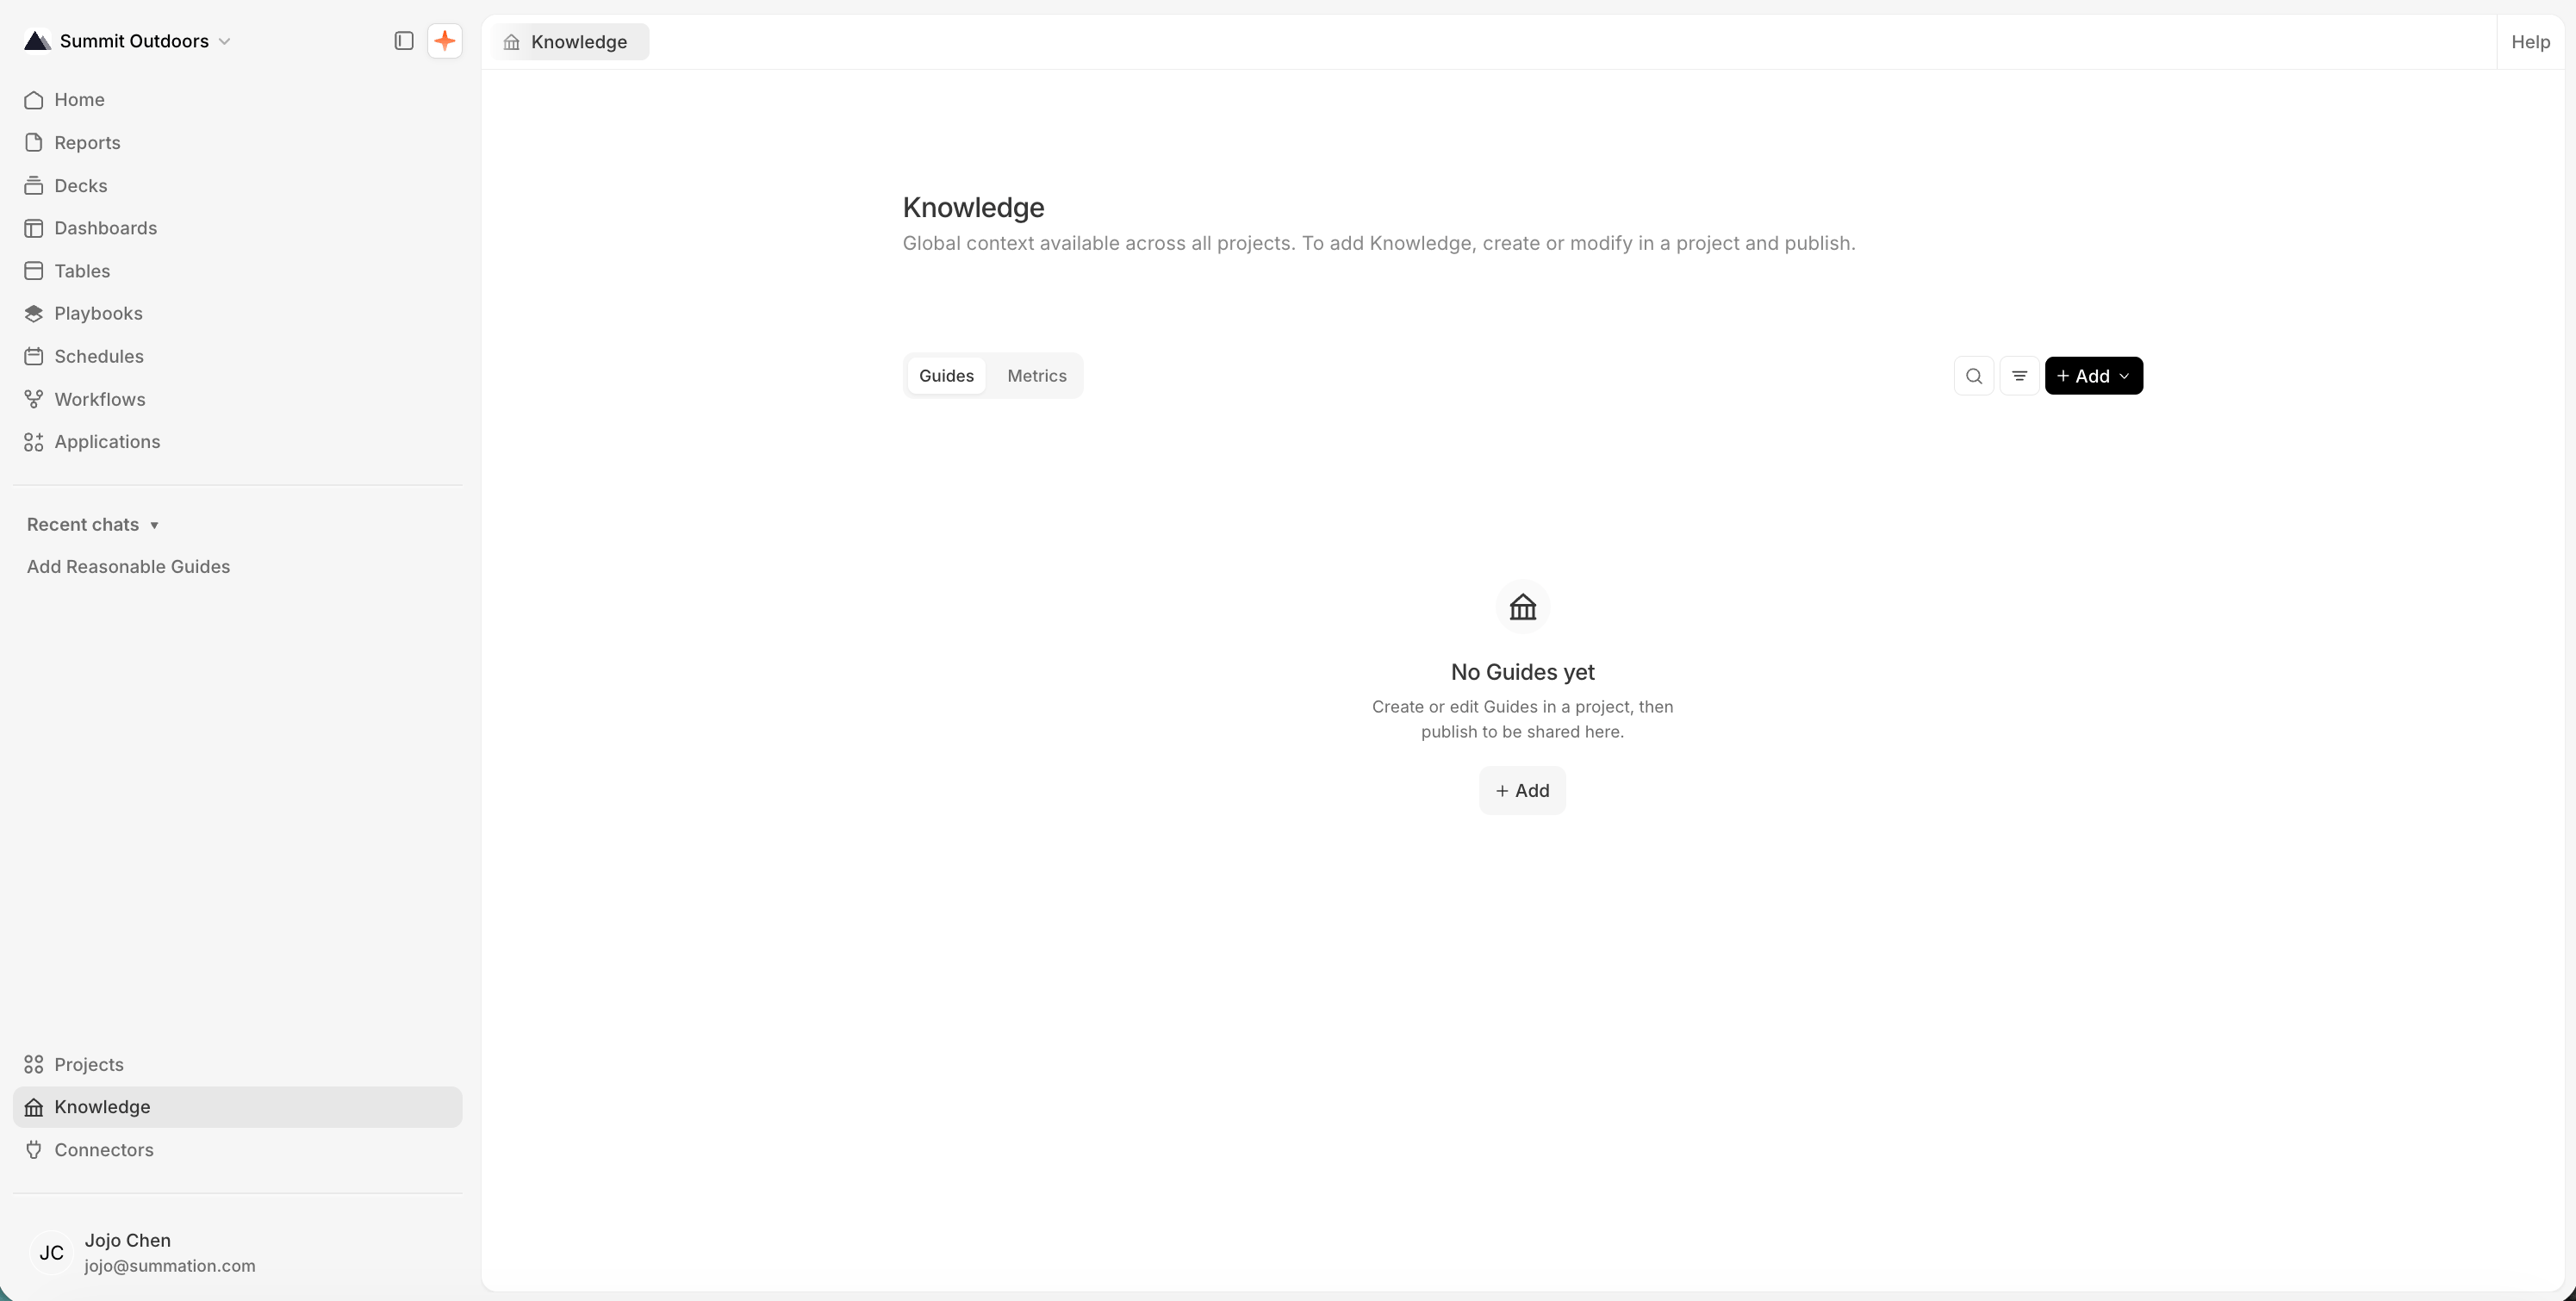
The Knowledge library, shared across your organization
Guides
A guide is a short document that tells Addison how your business works: a rule, a convention, or background that changes how a number should be read. If you find yourself re-explaining something in chat, it belongs in a guide. Write it as an instruction, not a description. “Use fiscal weeks starting Monday,” not “Our company has fiscal weeks.”What to put in a guide
The guides worth writing first answer a question your team fields every month:- Your fiscal calendar. When the fiscal year starts, where period boundaries fall, whether weeks run Monday to Sunday.
- When a number is final. “Revenue before the fifth business day is preliminary and will move.”
- What’s in and what’s out. Test accounts, internal orders, intercompany transactions, refunded lines, subsidiaries excluded from the consolidated view.
- Segment and hierarchy definitions. What makes an account Enterprise rather than SMB, which countries roll up into EMEA, which sites belong to which region.
- Currency handling. Your reporting currency, the rate source, and where in the pipeline conversion happens.
- Events that bend the numbers. A pricing change in March, a warehouse migration that broke two weeks of fulfillment data, an acquisition that reset the customer count.
- A query your team has already validated. Paste the SQL with a sentence on what it answers.
Create a guide
Three approaches, depending on where the context already lives.- Ask Addison. Describe the rule in a sentence: “Add a guide about our Q4 strategic initiatives.” Addison checks whether a guide already covers it, then drafts the body for you to review and save. You can attach a file to the same prompt (a glossary, a close checklist, an analyst onboarding doc) and ask for guides from what’s in it.
- Connect the wiki you already have. Most of this is written down already, in Notion, Confluence, or Glean. Connect the tool on the Apps tab, switch it on for a chat from the composer’s + menu under App connectors, then ask Addison to read a page or a space and turn it into guides. Nothing to copy across by hand.
- Write it yourself. Choose Create Manually for a full page with a title, a one-line description, Tags, and the body. Worth the time only when you already know the exact wording.
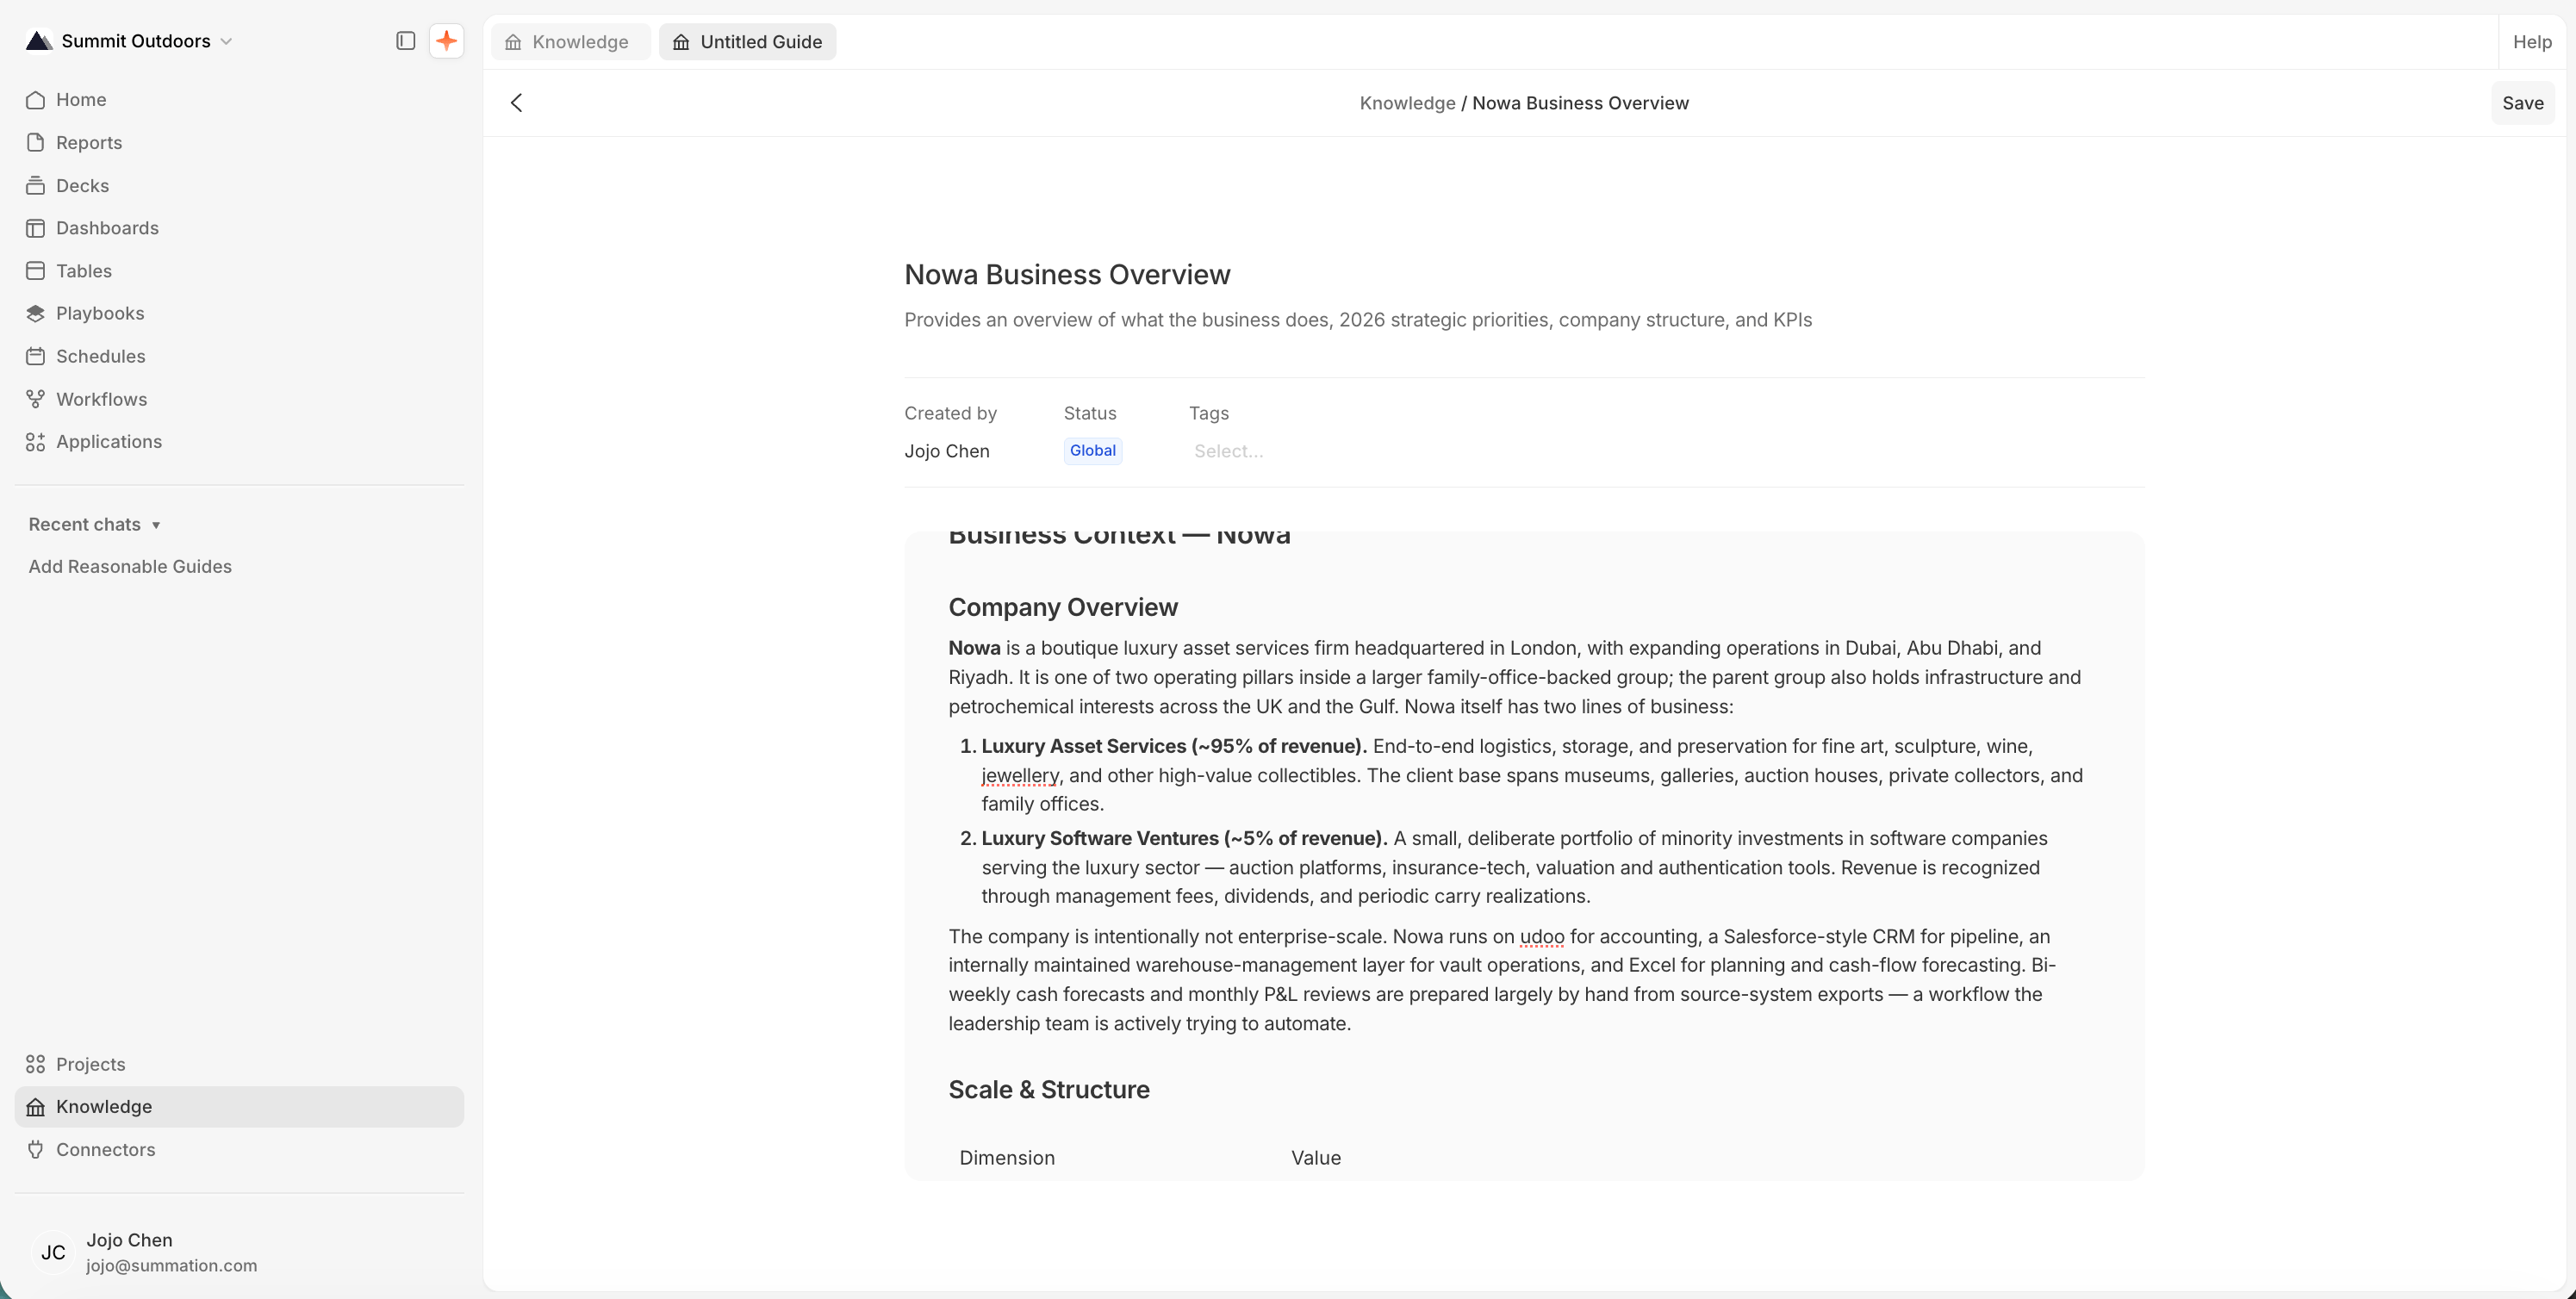
A guide, open for editing
Metrics
A metric is one number, defined once, with its calculation attached. Define “gross margin” as a metric and it computes the same way everywhere: in a chat answer, on a dashboard card, and in a scheduled report. A guide tells Addison what a word means. A metric decides what the number is.What to make a metric
The test is disagreement. If two people in your company have ever reported different numbers for the same term, make it a metric. Common candidates:- Revenue and margin: net revenue, gross margin, contribution margin
- Recurring revenue and retention: ARR, MRR, net revenue retention, churn rate
- Cash and working capital: burn, runway, DSO, cash conversion
- Volume and throughput: units shipped, orders processed, open backlog
- Service levels: on-time delivery rate, fill rate, first-pass yield
- Efficiency: inventory turns, cost per unit, utilization
- Ratios where the denominator is the real argument: average order value, cost per order, margin percentage
net_revenue, not a second metric.
Check for a near-match before you add one. Near-duplicates with slightly different names are how a catalog stops being trusted. Addison checks for you before it drafts.
Create a metric
Three approaches, depending on what you already have.- Ask Addison. Describe the number: “Profit is Revenue minus Cost.” Addison finds the table behind it, writes the calculation, runs it to confirm the result is plausible, and validates the definition before handing back a draft. It asks about anything ambiguous, such as the time grain or whether deleted rows count, rather than guessing. Addison can save a draft into a project; publishing to the whole organization stays a human decision.
-
Bring an existing semantic layer. If your metrics already live in dbt, Cube, LookML, or Snowflake semantic views, attach the YAML to the same prompt instead of retyping them. Addison maps each definition onto a table it can query, validates it, and creates a whole family in one pass, including the ratios and derived metrics built on the simple ones beneath them. Two things to know:
- Summation stores definitions as dbt semantic-layer (MetricFlow) YAML, so dbt files carry across most directly. The result is the same from any of the others.
- Every metric needs a table already connected to Summation with a date column in it. Bring the layer across one domain at a time, because a smaller batch is one you can actually review.
- Write the YAML yourself. Choose Create Manually for a panel with the two things a metric needs: the Table it is defined against, and the Metric Definition YAML. Name, description, and tags are read out of that YAML rather than typed beside it.
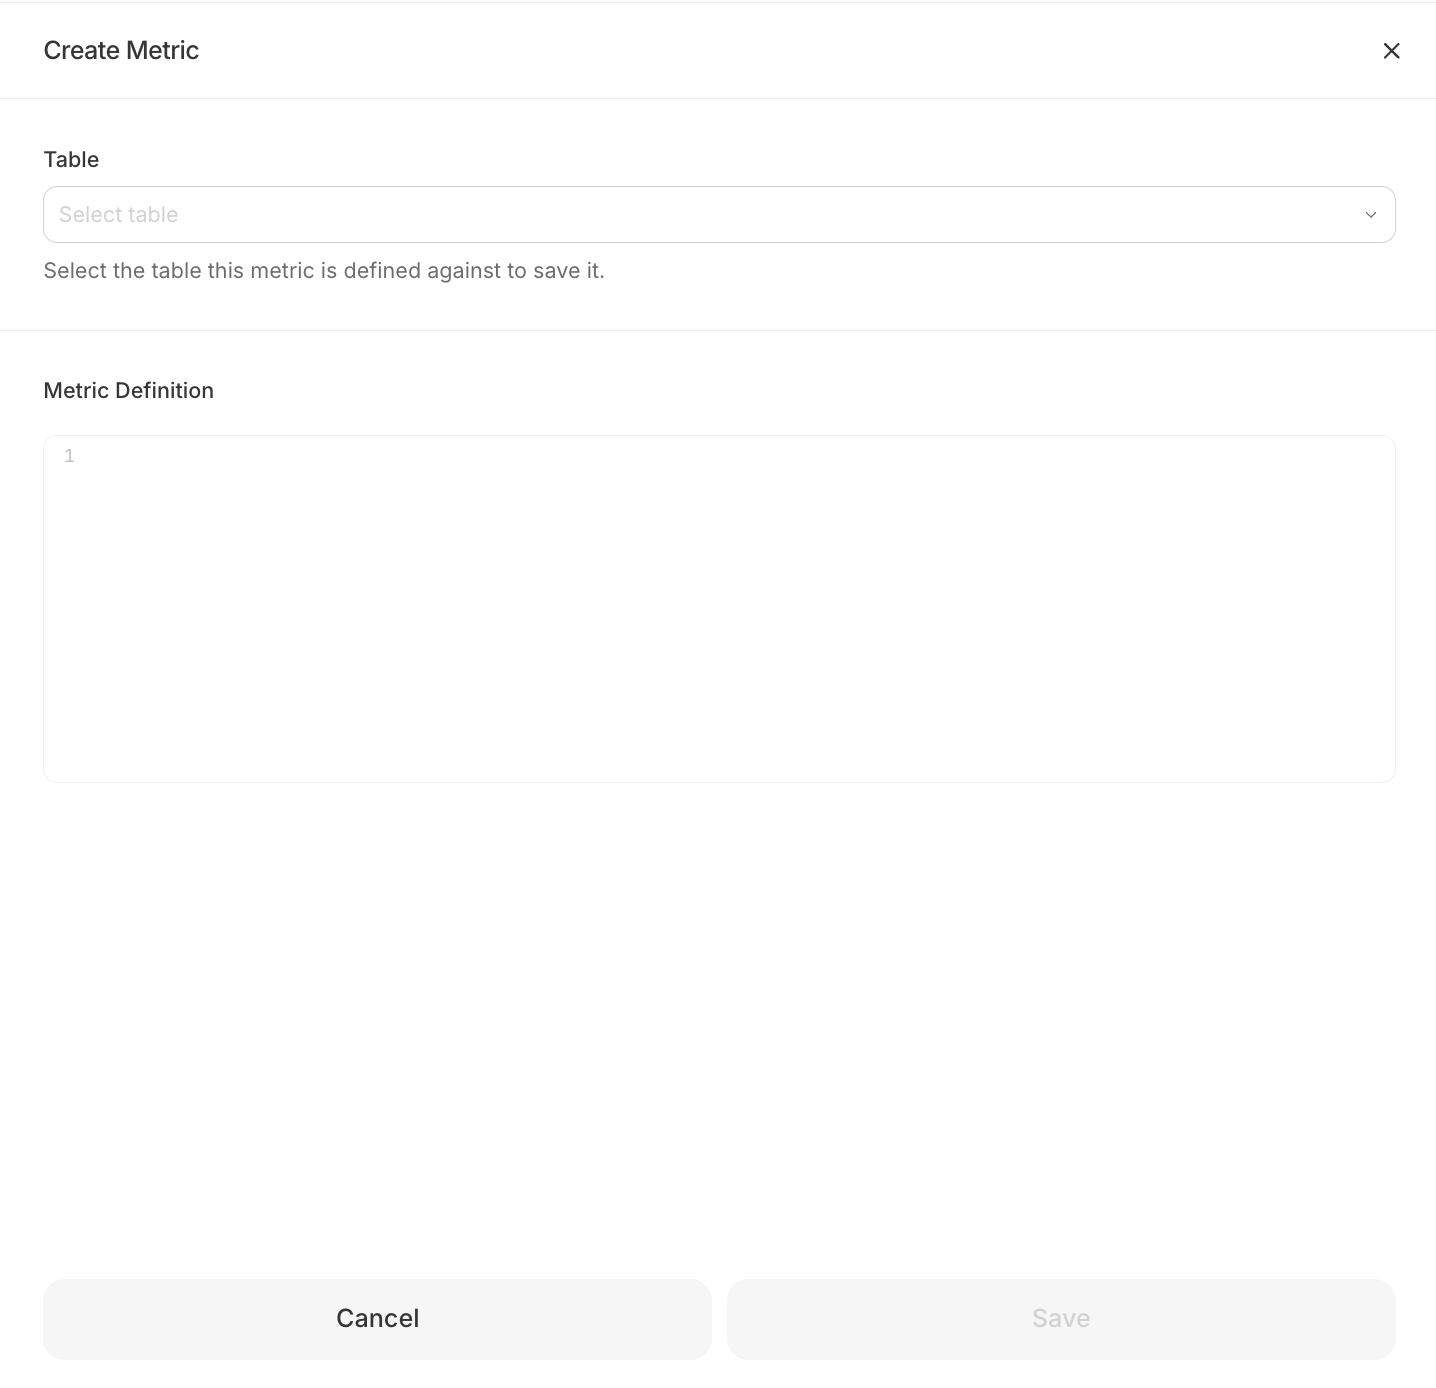
Creating a metric by hand: a table and a definition
Metric definition example
Tags
Tags group related guides and metrics. Both kinds draw on one shared vocabulary per project, so tagging a revenue guide and a revenue metric alike keeps a definition and the rule that governs it together in the listing. For a guide, use the Tags field in the editor. For a metric, tags come out of the definition’sconfig.tags rather than a separate field:
- Tag by domain, not by owner.
finance,supply-chain, andmarketingsurvive a reorg;janes-teamdoesn’t. - Keep the vocabulary small. A tag earns its place by being reused. One asset carrying a tag of its own organizes nothing.
- Match case exactly.
Financeandfinanceare two different tags. Pick one form and hold to it, because nothing merges them later.
Save context as you work
When a correction in chat will matter again, save it instead of re-explaining it next month. Ask Addison in that same conversation to keep it as a guide or a metric. You can also highlight a term in a report: Addison proposes a definition inline, and Add saves it.Global vs. project
Every guide and metric lives at one of two levels:- Global (the Knowledge page, from the left nav): shared with the whole organization. Addison uses it in every project. Add something here when every project should have it.
- Project (the Knowledge button at a project’s top-right): scoped to that one project.
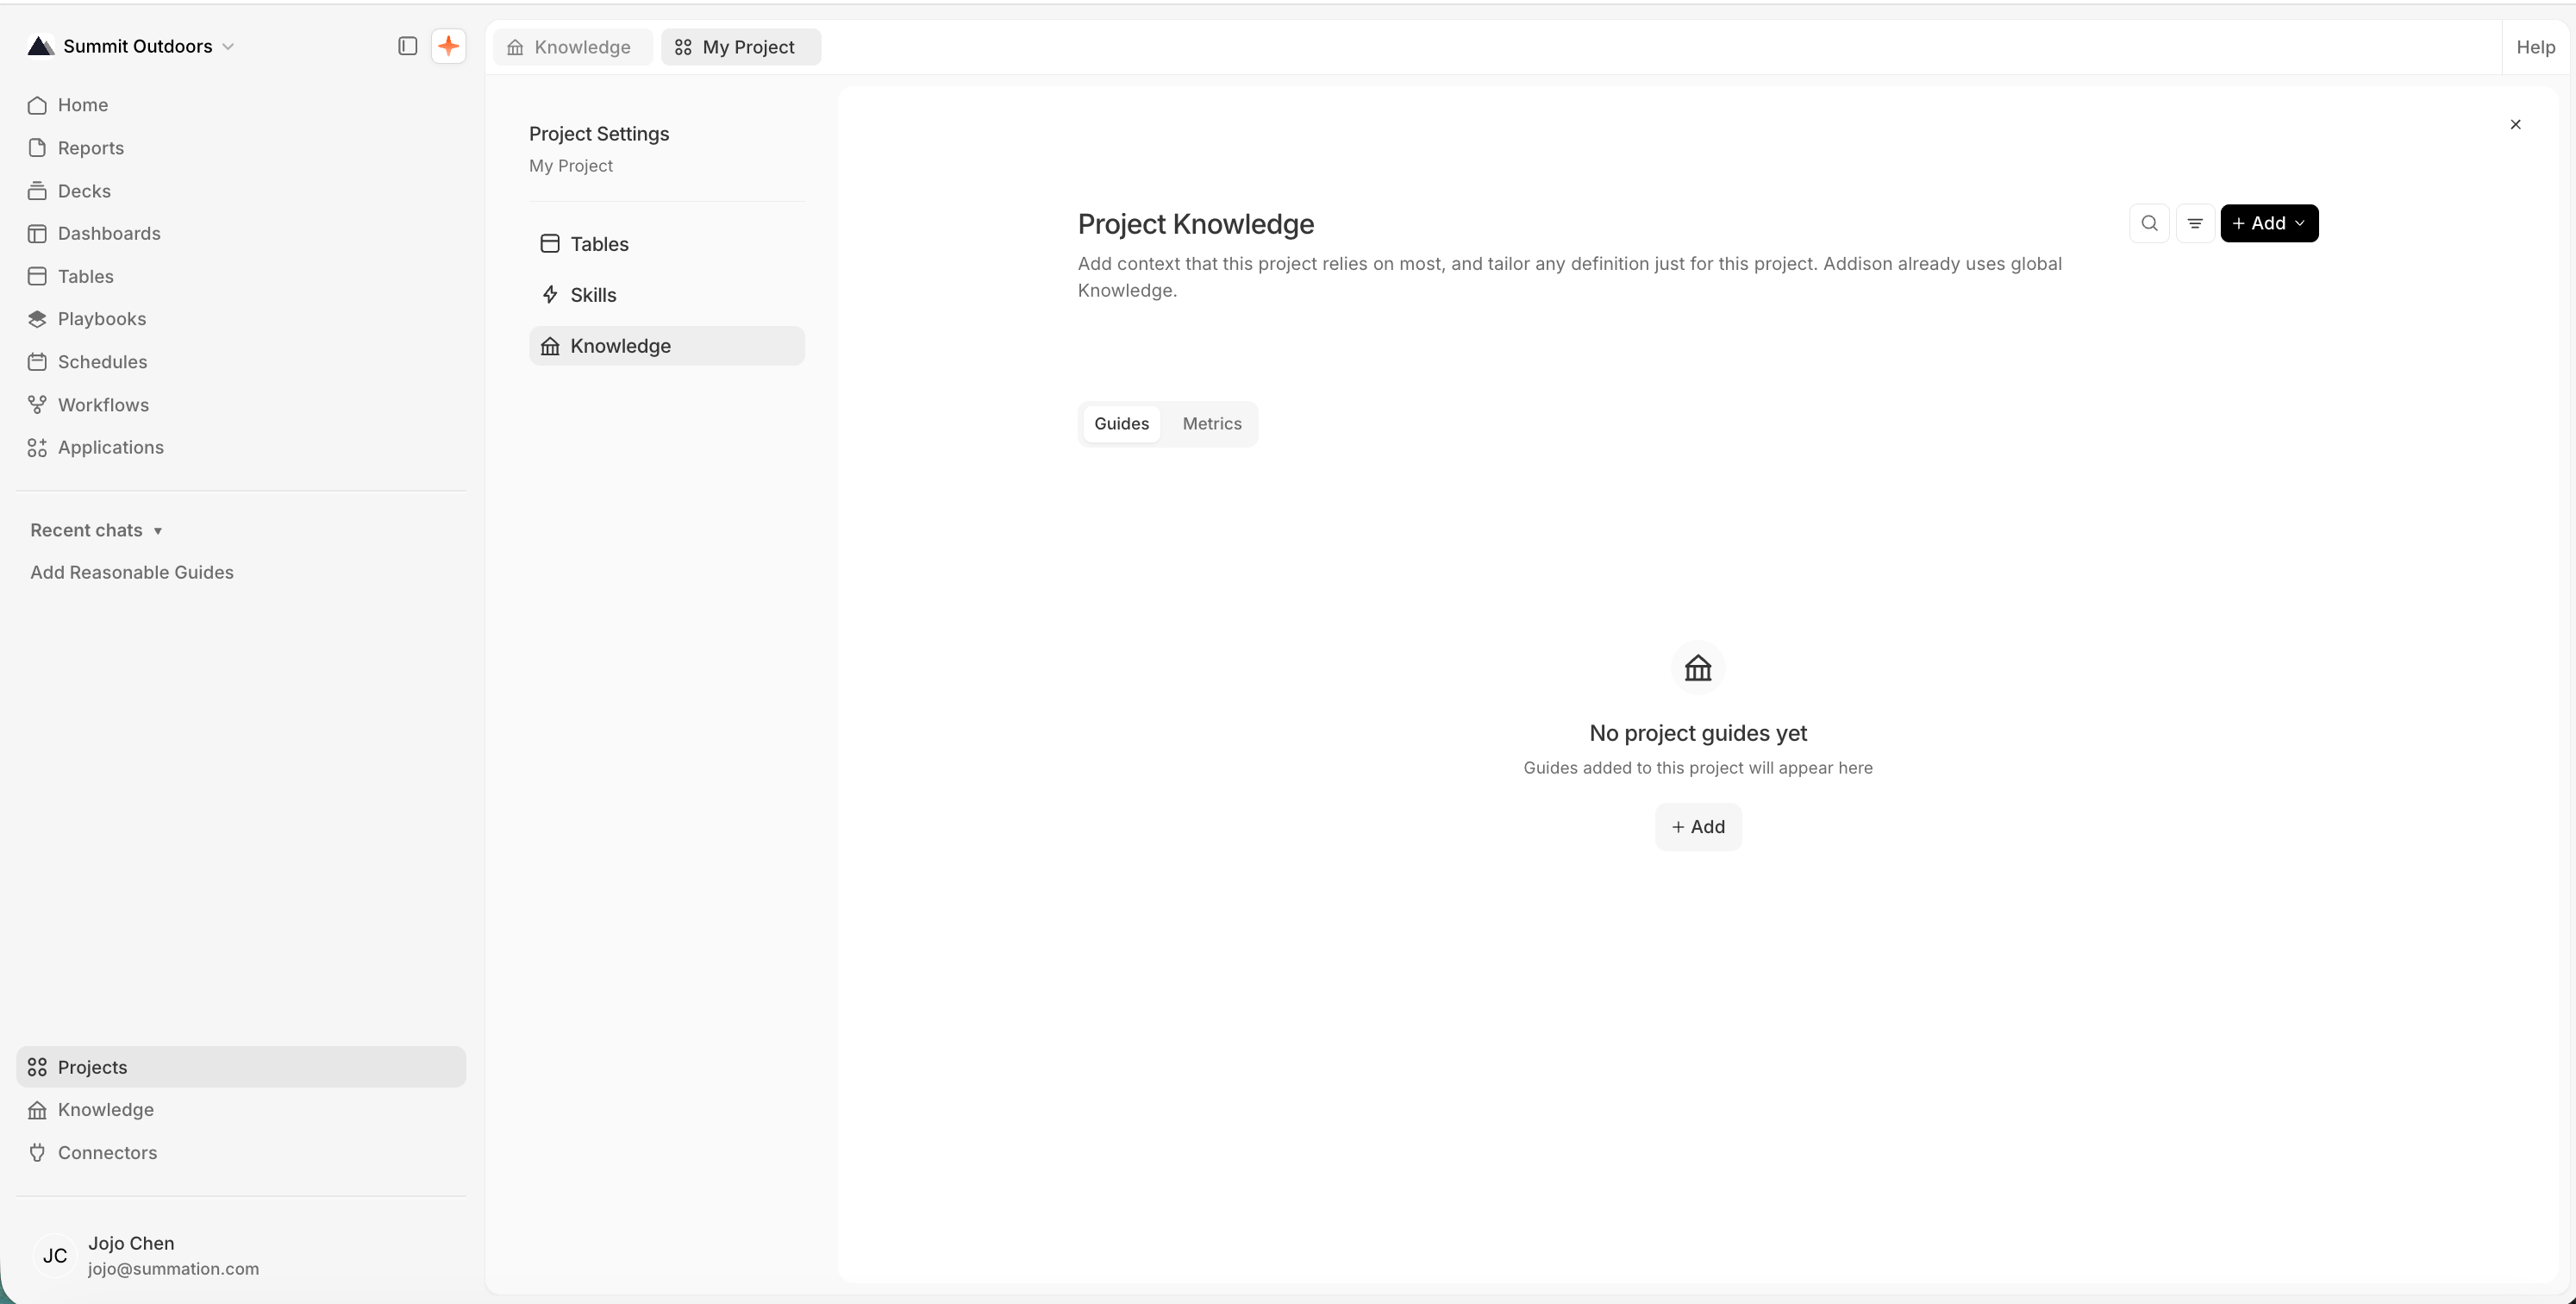
A project's own Knowledge
- Add a global guide or metric to a project to prioritize it. Addison can already see everything in global from any project; adding one to a project just makes Addison reach for it first.
- To customize a global guide or metric for one project, add it to the project and edit it there. Your edit applies only to that project. The global version doesn’t change.
- To share a project’s guide or metric with the whole organization, click Publish to Knowledge. An admin has to approve it before it goes live everywhere.
- Or create a guide or metric that stays in the project, with no plan to publish it.
How Addison uses Knowledge
Without Knowledge, Addison reasons from table and column names and your catalog. Knowledge replaces those guesses with your team’s answers:- “Revenue” resolves to net revenue after refunds, not gross
- “Active user” means logged in within the last 30 days
- Average order value is computed the one way your team has agreed on, not reinvented per chat
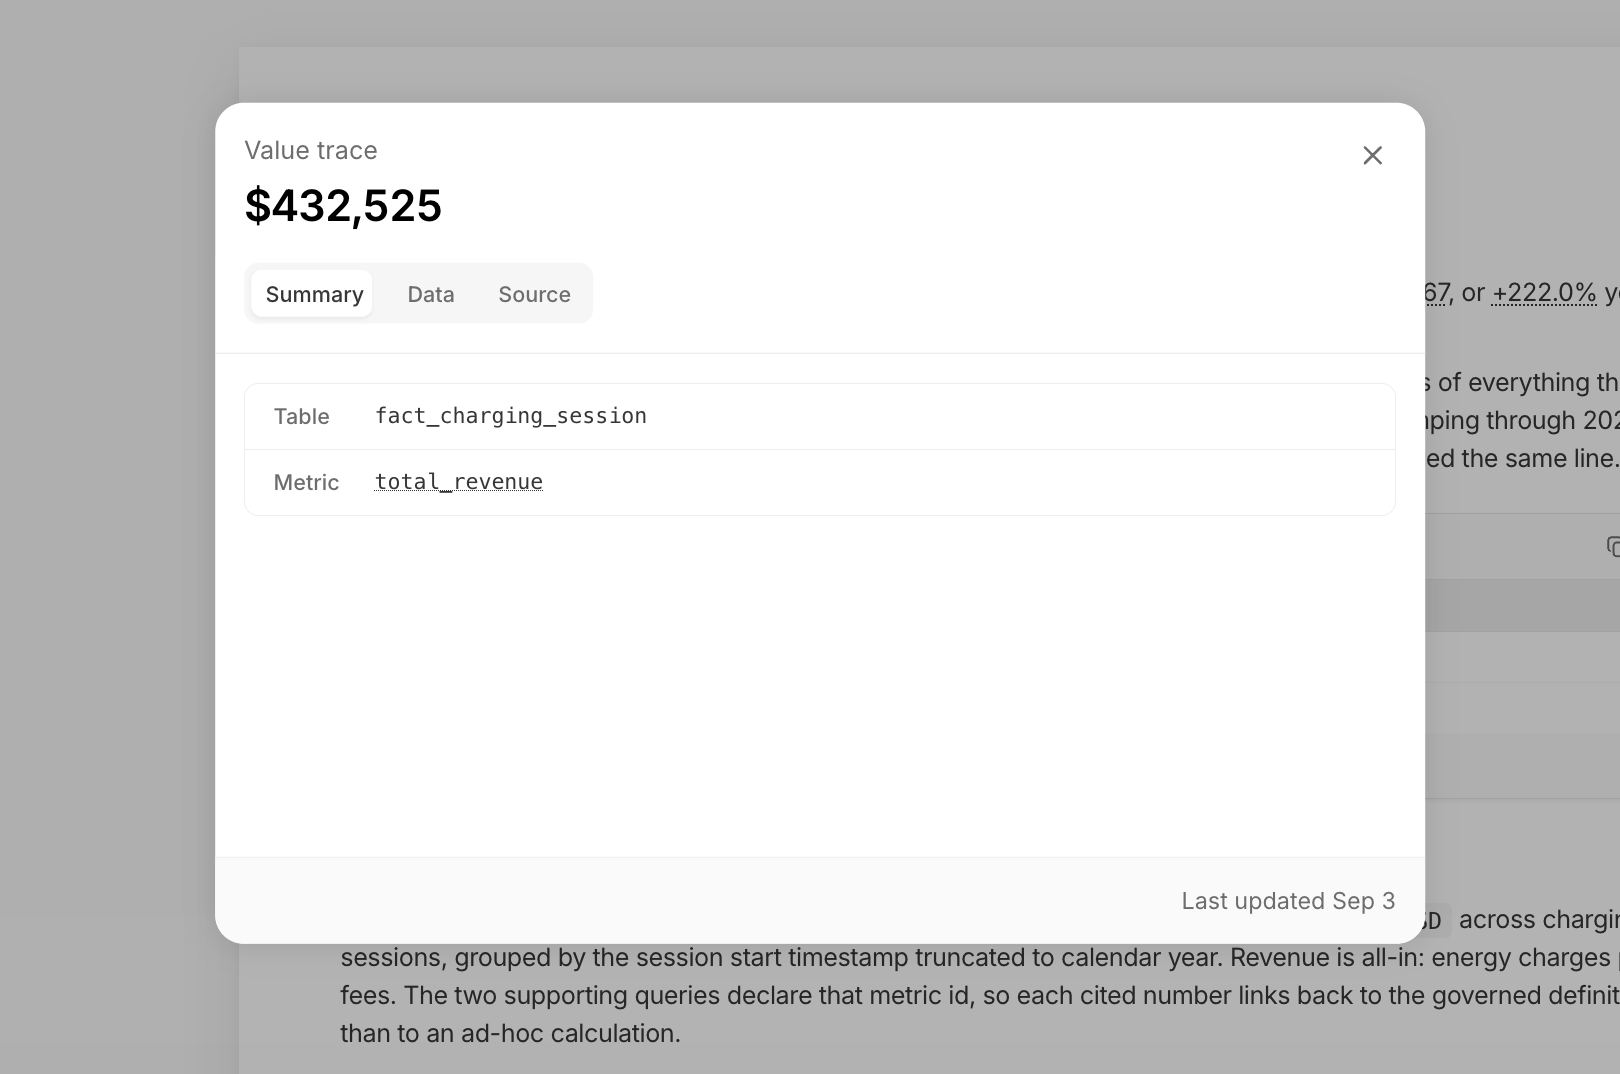
A Value trace: the number resolved through a governed metric