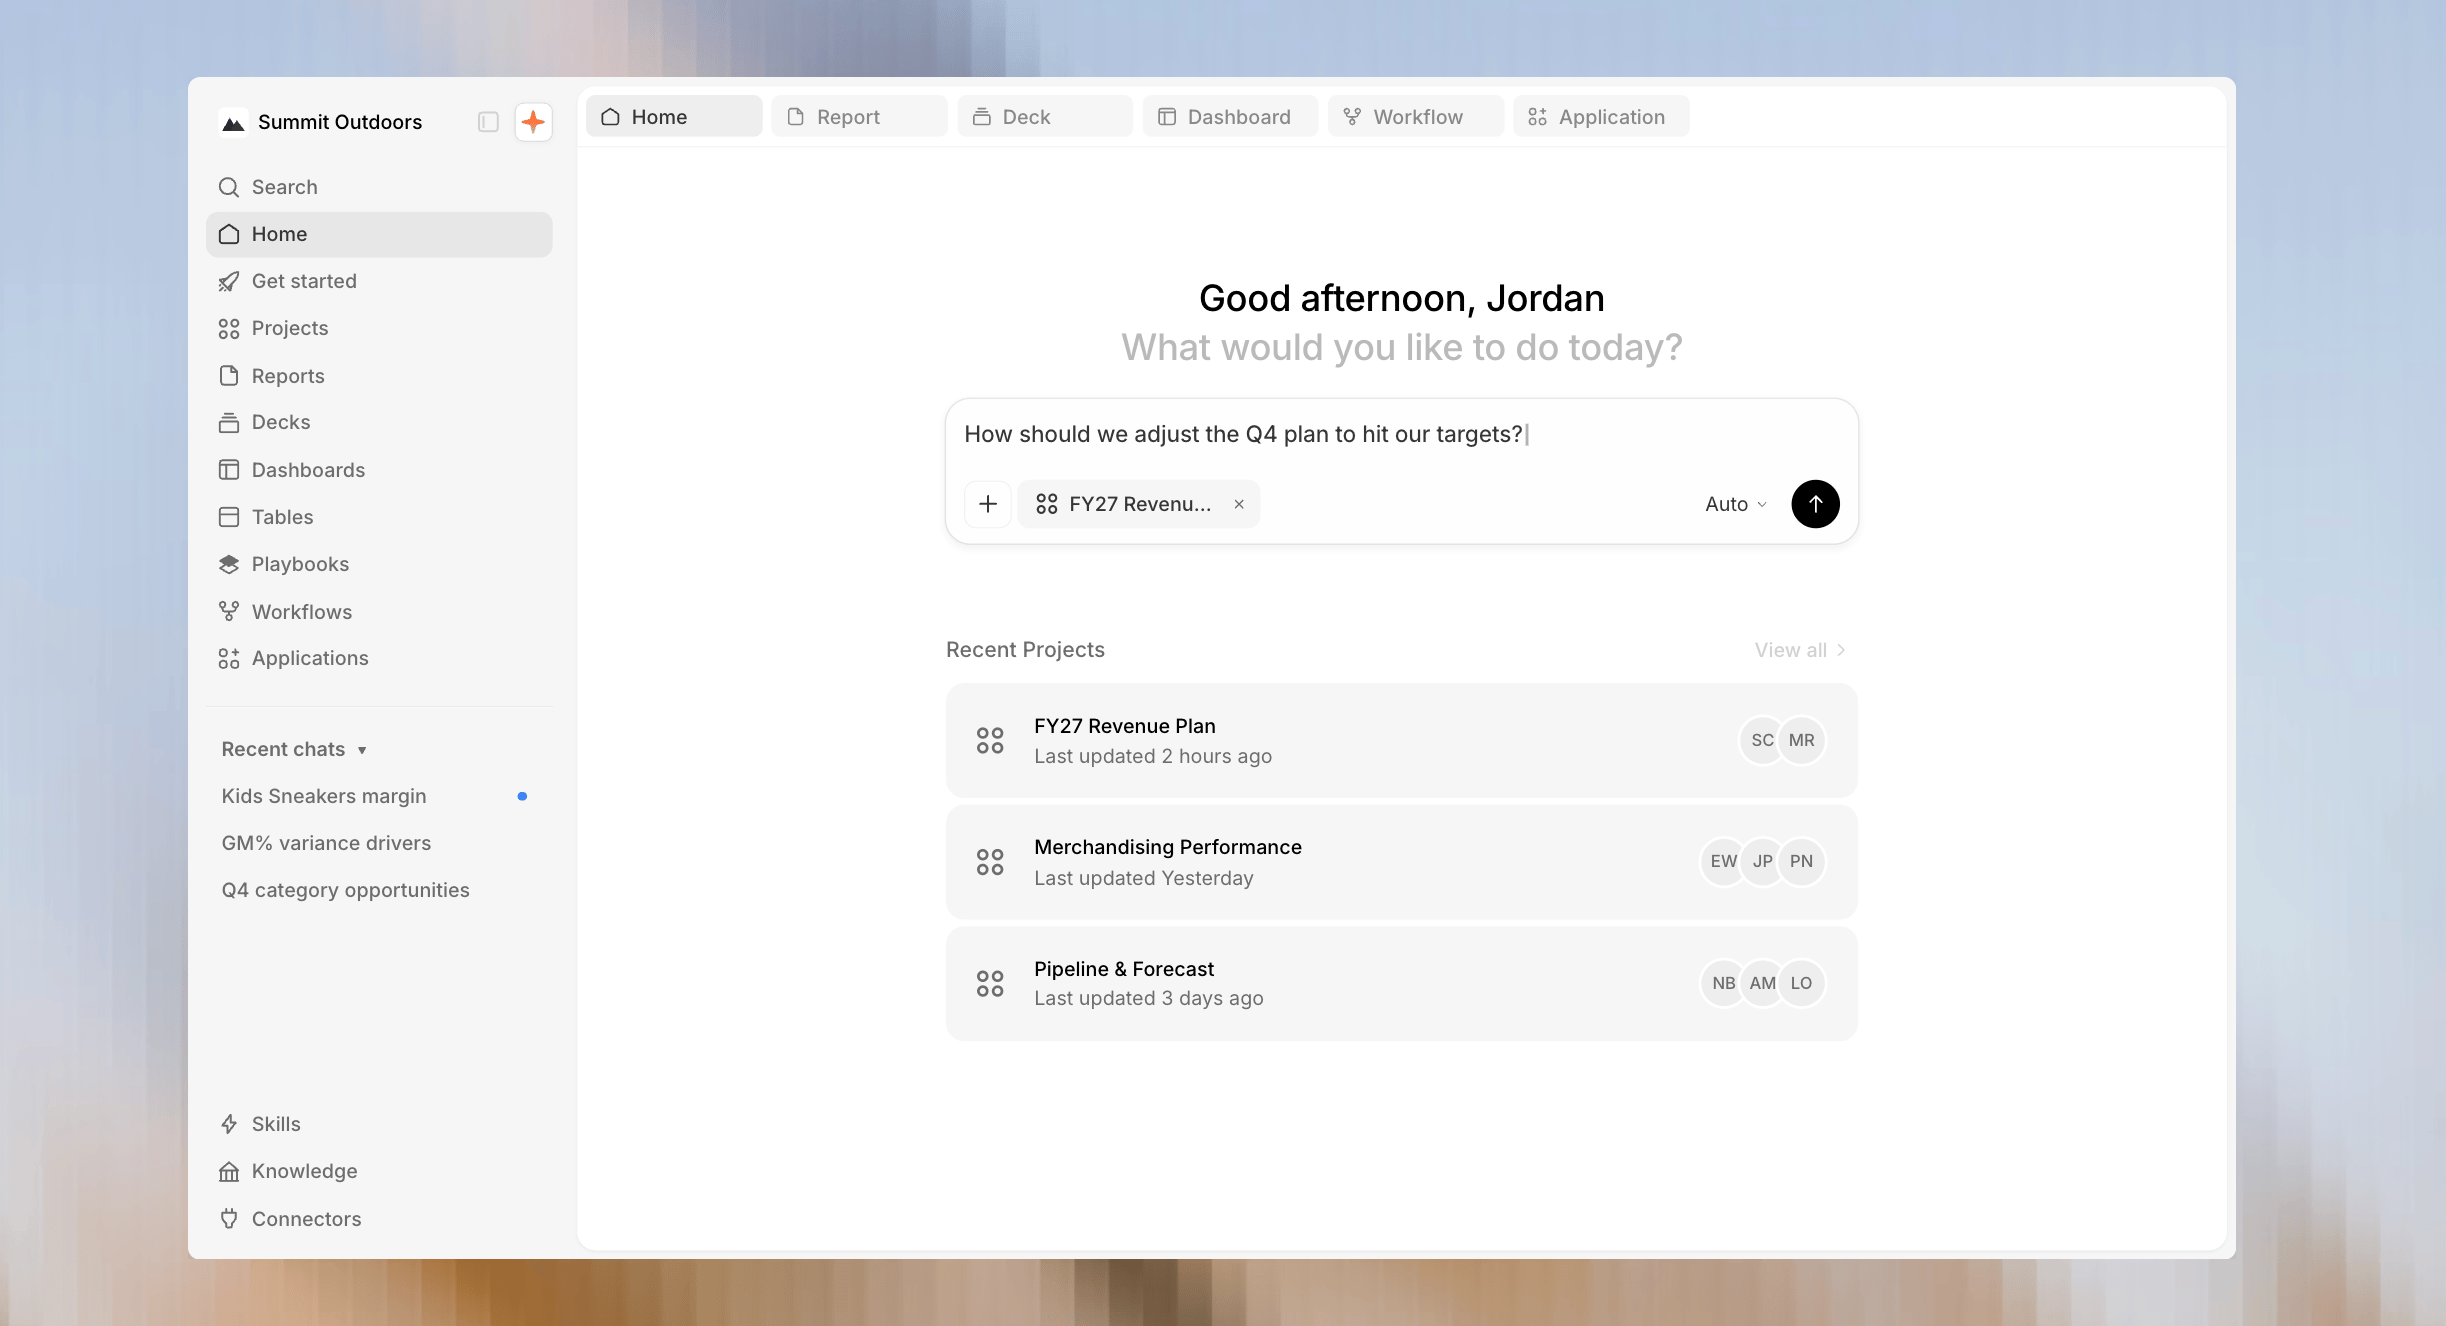
The Summation home: Addison's composer, your recent projects, and the left nav to every feature
Core concepts
Projects
The primary container for your work — holding files, data connections, reports, dashboards, knowledge docs, and chat threads with Addison.
Addison
The AI agent behind the conversational analytics experience. Ask questions, generate reports, dashboards, and decks, and explore your data through chat.
Connectors
Connect to Snowflake, BigQuery, Redshift, PostgreSQL, and more — or upload CSV and Excel files.
Tables
Your data grid — Summation tables you build, import, or compute, plus connector-backed tables and saved views.
Reports
AI-generated analytical documents with metrics, charts, summaries, and insights. Supports verification and commenting.
Dashboards
Interactive views of your data built from charts, filters, and cards.
Decks
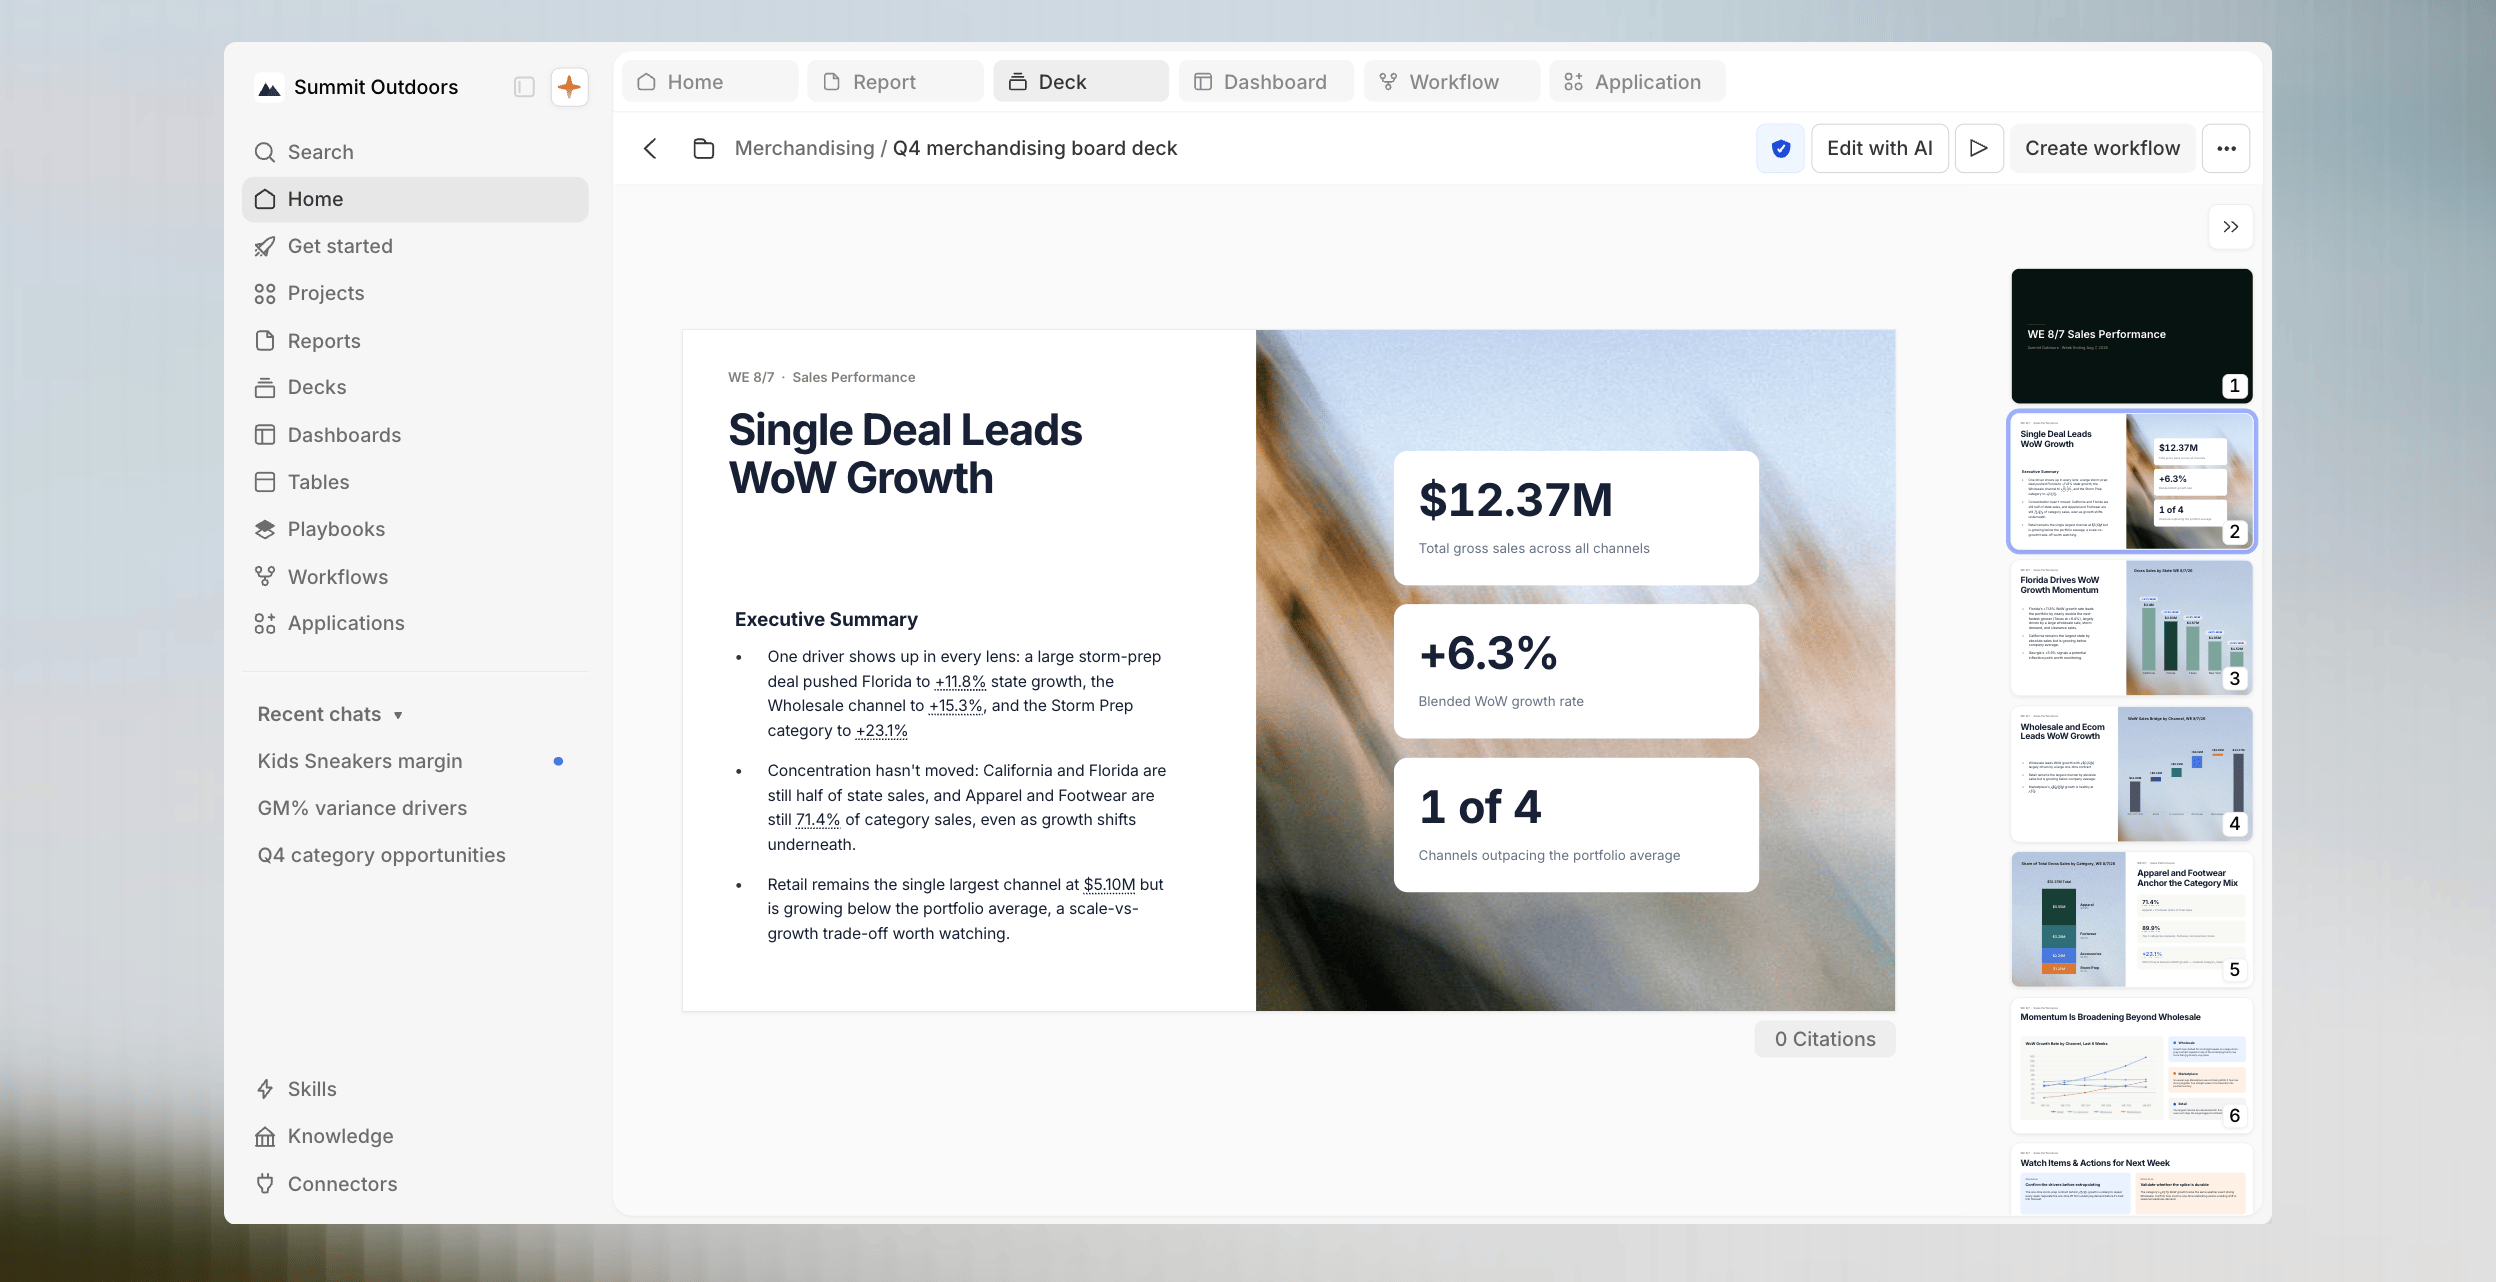
Presentation-ready slides Addison builds from your analysis, ready to present or share.
Playbooks
Reusable analytical workflows that combine a report template, data assets, and SQL templates.
Knowledge
Contextual documentation that helps Addison understand your data and business domain.
How it works
1
Connect your data
Set up a connection to your data source (Snowflake, BigQuery, Redshift, PostgreSQL, Databricks, S3, and more) or upload CSV/Excel files. Connected data is queried in place via federated SQL — no data movement required.
2
3
4
Create reports, dashboards, and decks
Kick off a report through chat, the Create button, or a playbook, or build interactive dashboards and presentation-ready decks. Reports come with verifiable data citations you can trace back to source.
5
Verify and share
Run verification to audit the accuracy of citations, queries, and claims. Share reports, dashboards, and decks with your team.