Tables are the data behind everything in Summation — the rows your reports, dashboards, and Addison read from. They live in your organization’s data grid at /table and come in two types: Summation tables (you create, import, or compute them in Summation) and connector tables (backed by an external source through a connector).
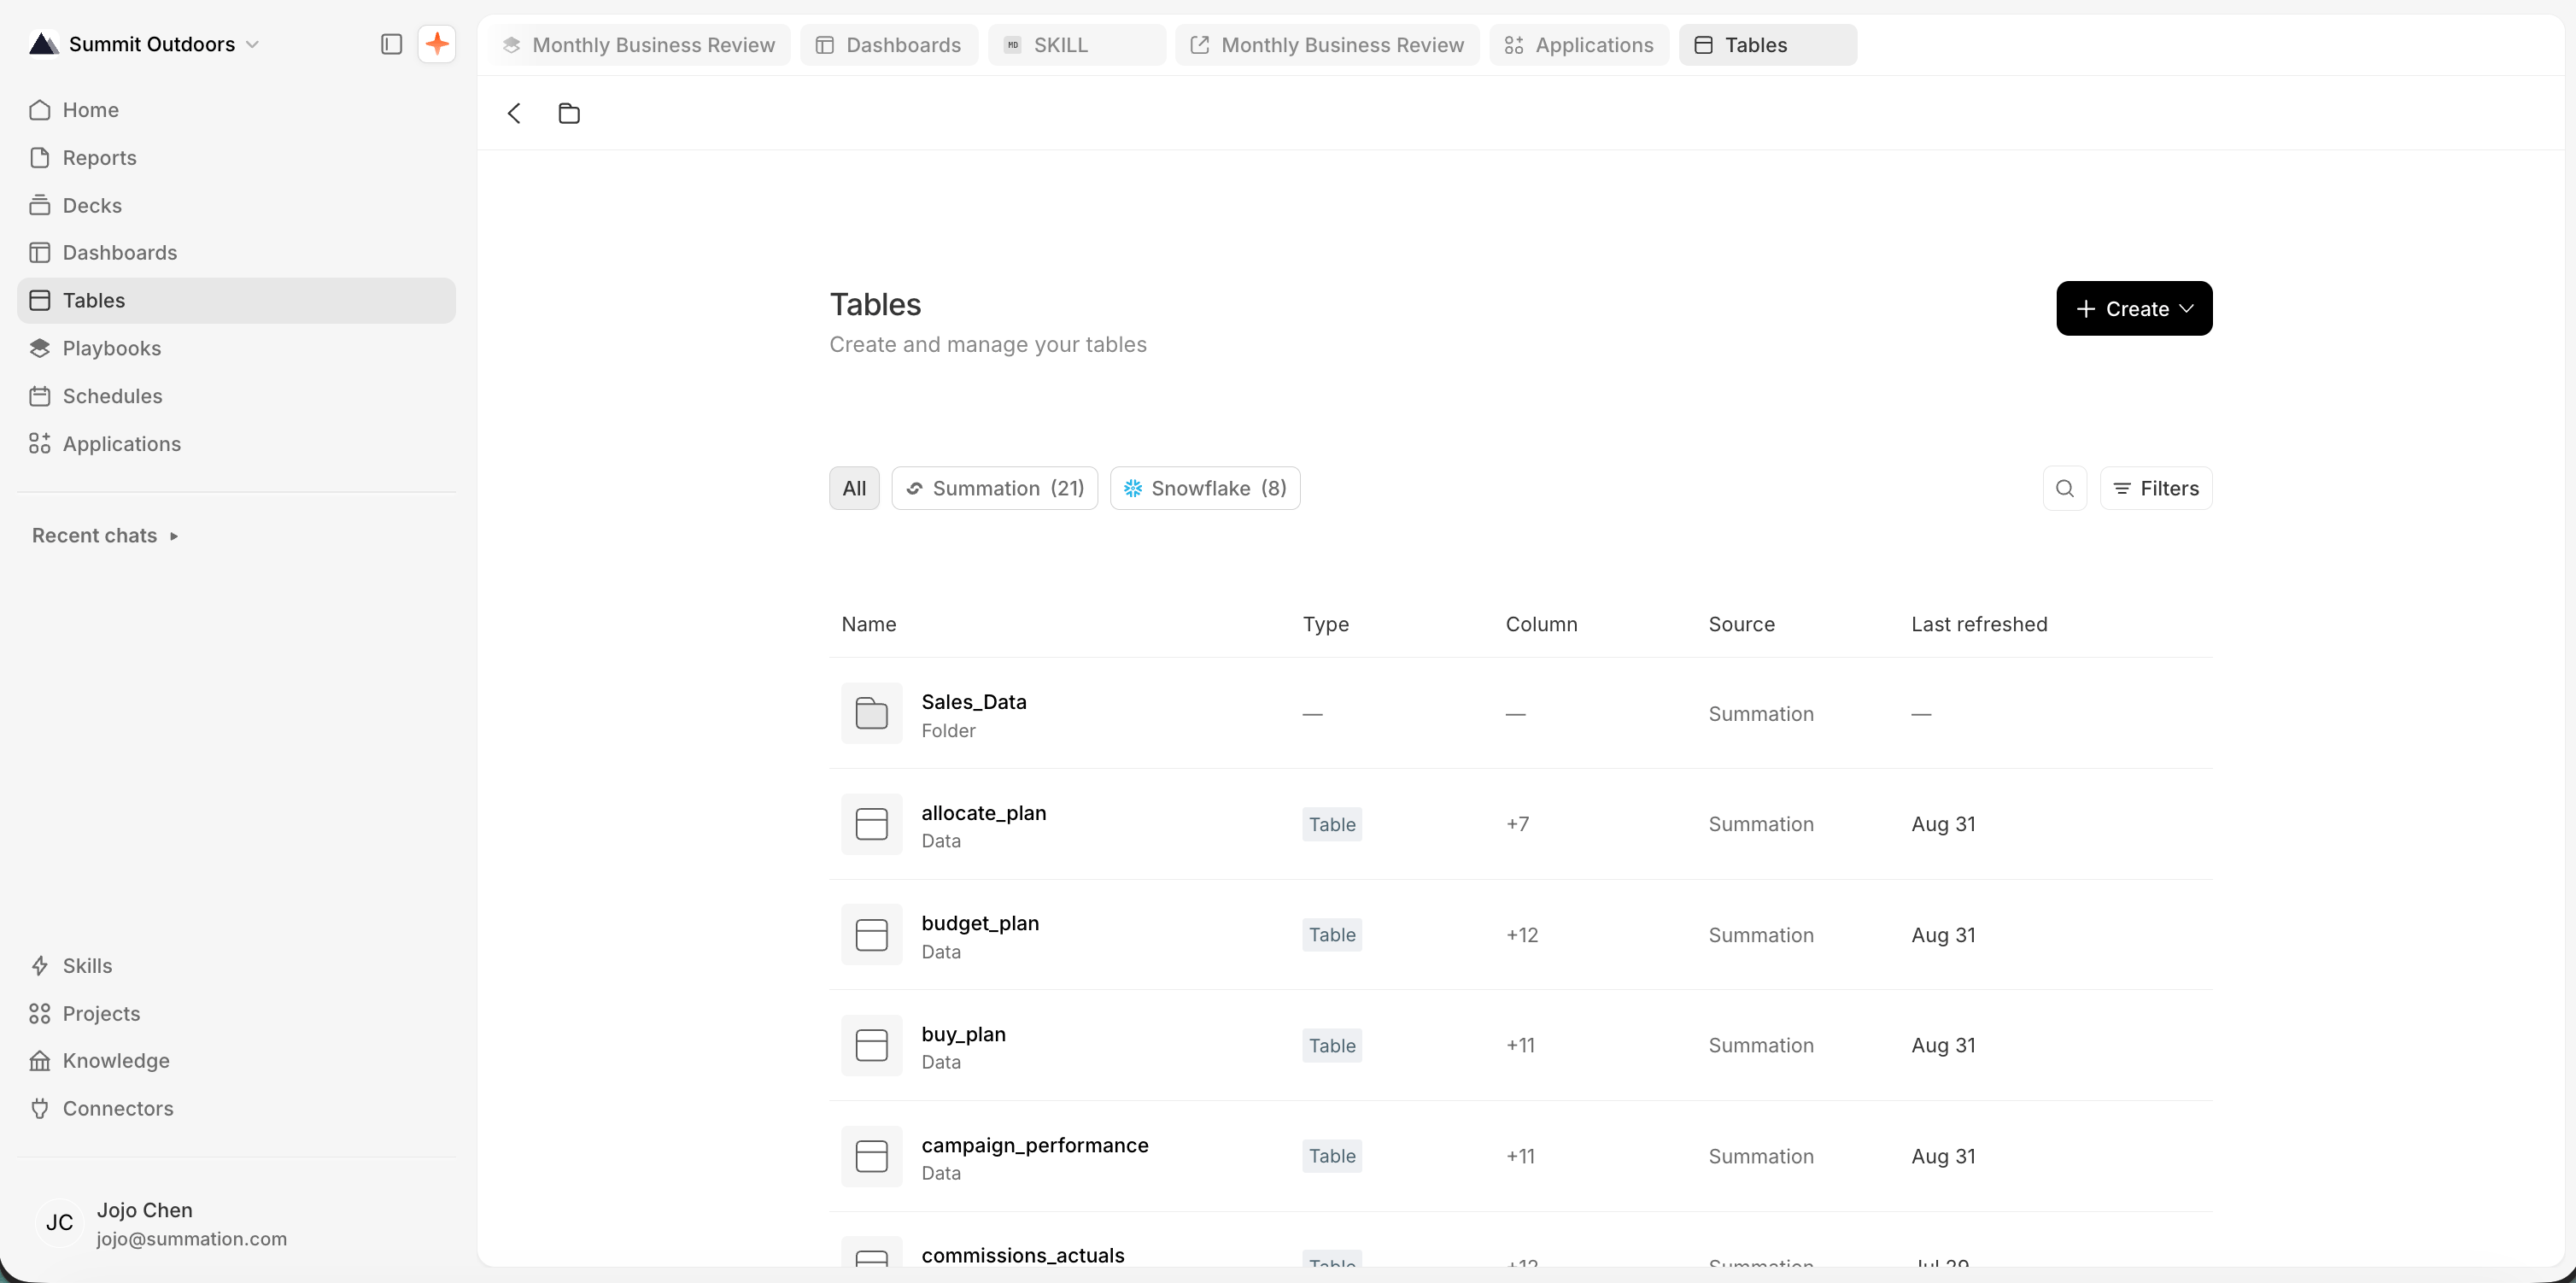
The Tables page titled 'Create and manage your tables', with a Create button top-right. Type filter chips read All, Summation (86), BigQuery (8), Snowflake (1), and GitHub (0). A table lists folders and tables with Name, Type, Column, Source, and Last refreshed columns; a Data files tree sits on the left.

The Tables page

Find and open a table

The Tables page (/table, shown above) lists every table and view in the data grid. Filter by source with the type chips (Summation or a connector), search within a folder, and click a table to open its grid. In the grid you can browse rows, apply Views and filters, and Export CSV.
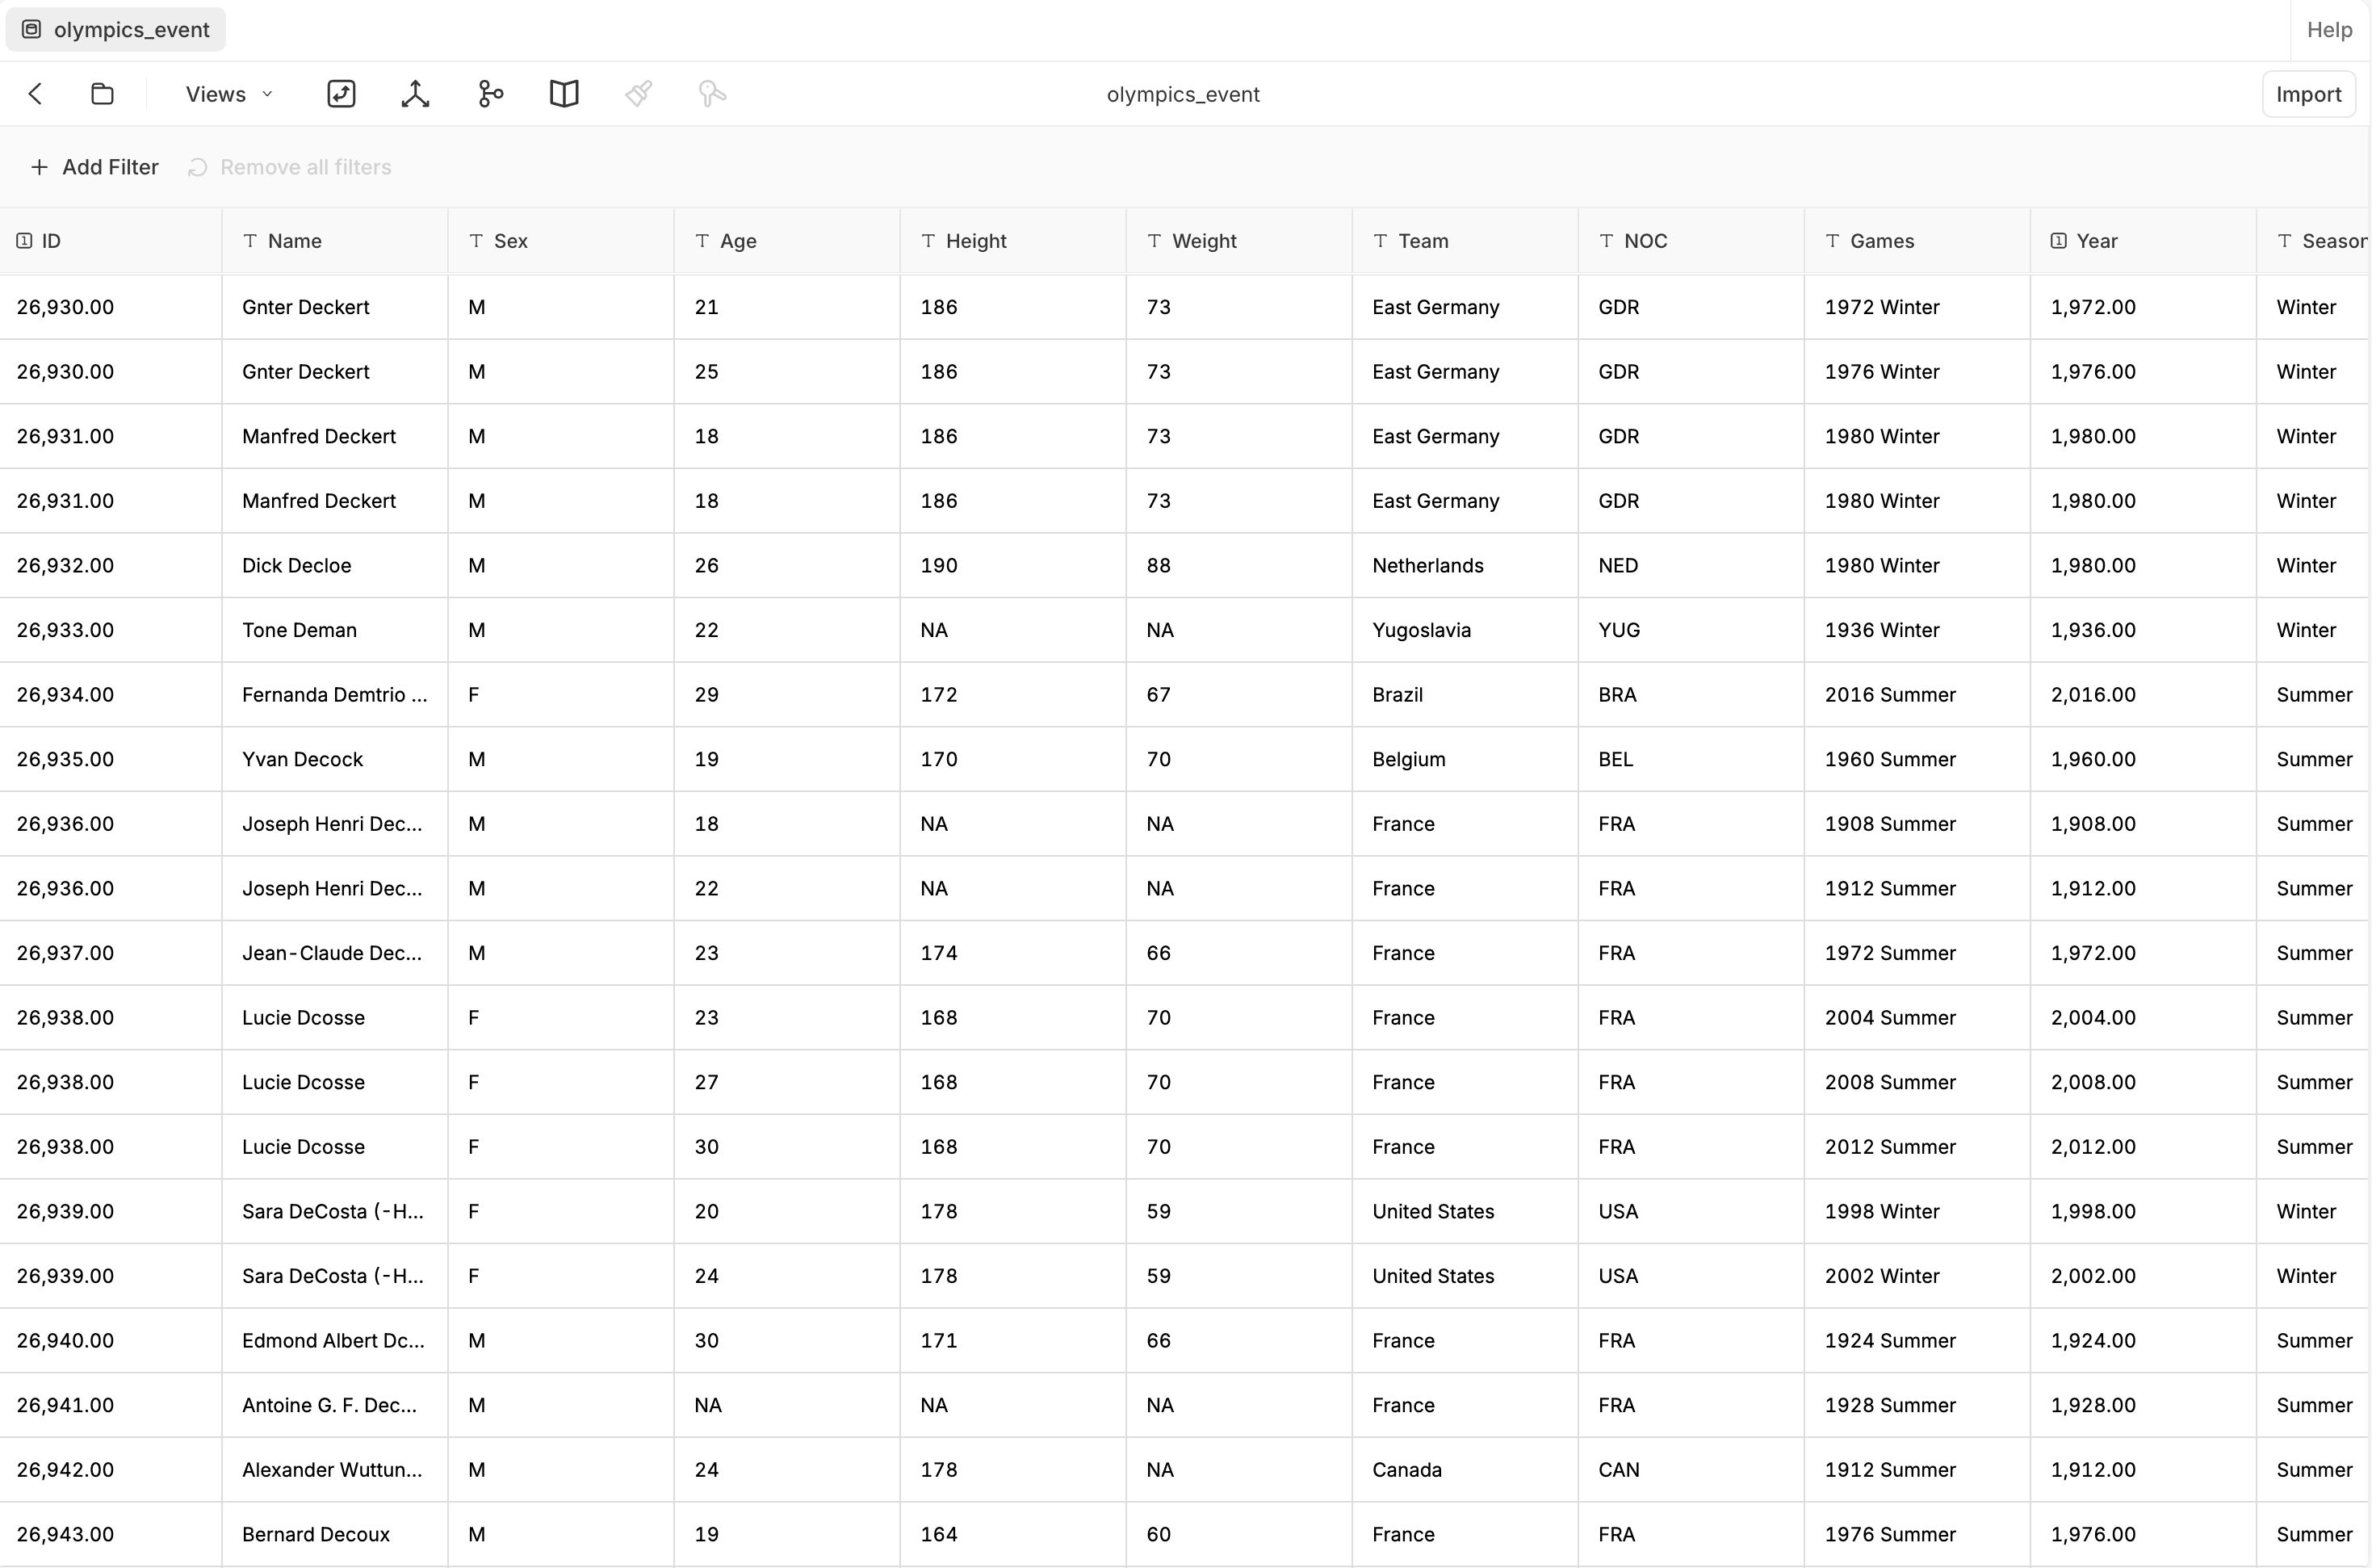
An open table 'olympics_event' shown as a spreadsheet grid with typed columns (ID, Name, Sex, Age, Height, Weight, Team, NOC, Games, Year, Season), a Views dropdown, an Add Filter control, and an Import button.

An open table

Create a table

Use Create (top-right of /table) to make a Summation table. Each kind has its own page:
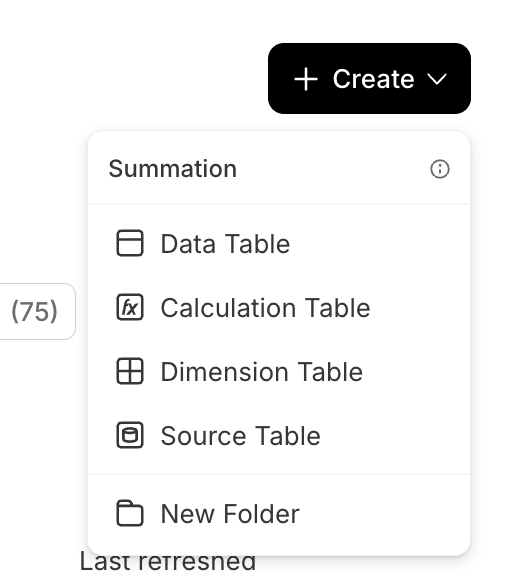
The Create menu on the Tables page, headed 'Summation', with Data Table, Calculation Table, Dimension Table, Source Table, and New Folder.

The Create menu

Catalog

Every table and view carries a catalog — the metadata that describes it and its columns, and what Addison reads to understand your data. Open it from the Catalog button (book icon) in a table’s toolbar.
  • Table: a description, owner, source system, and an agent description written for Addison (what the entity contains and when to use it). (A table also has a modeling tier, but it’s set through the API only — it isn’t shown or editable here.)
  • View: only a description, owner, and agent description.
  • Columns: a description and an agent description each.
In the panel, the Context tab shows the agent-facing System Description with a User Defined override you can edit; the Columns tab edits per-column descriptions. A standalone Data Catalog home browses all of it across the grid.Because Addison relies on it, richer catalog metadata (especially agent descriptions) directly improves its answers. Separately, a project attaches specific tables and views to its catalog to control what Addison can see there; an empty project catalog means the agent has no data context.
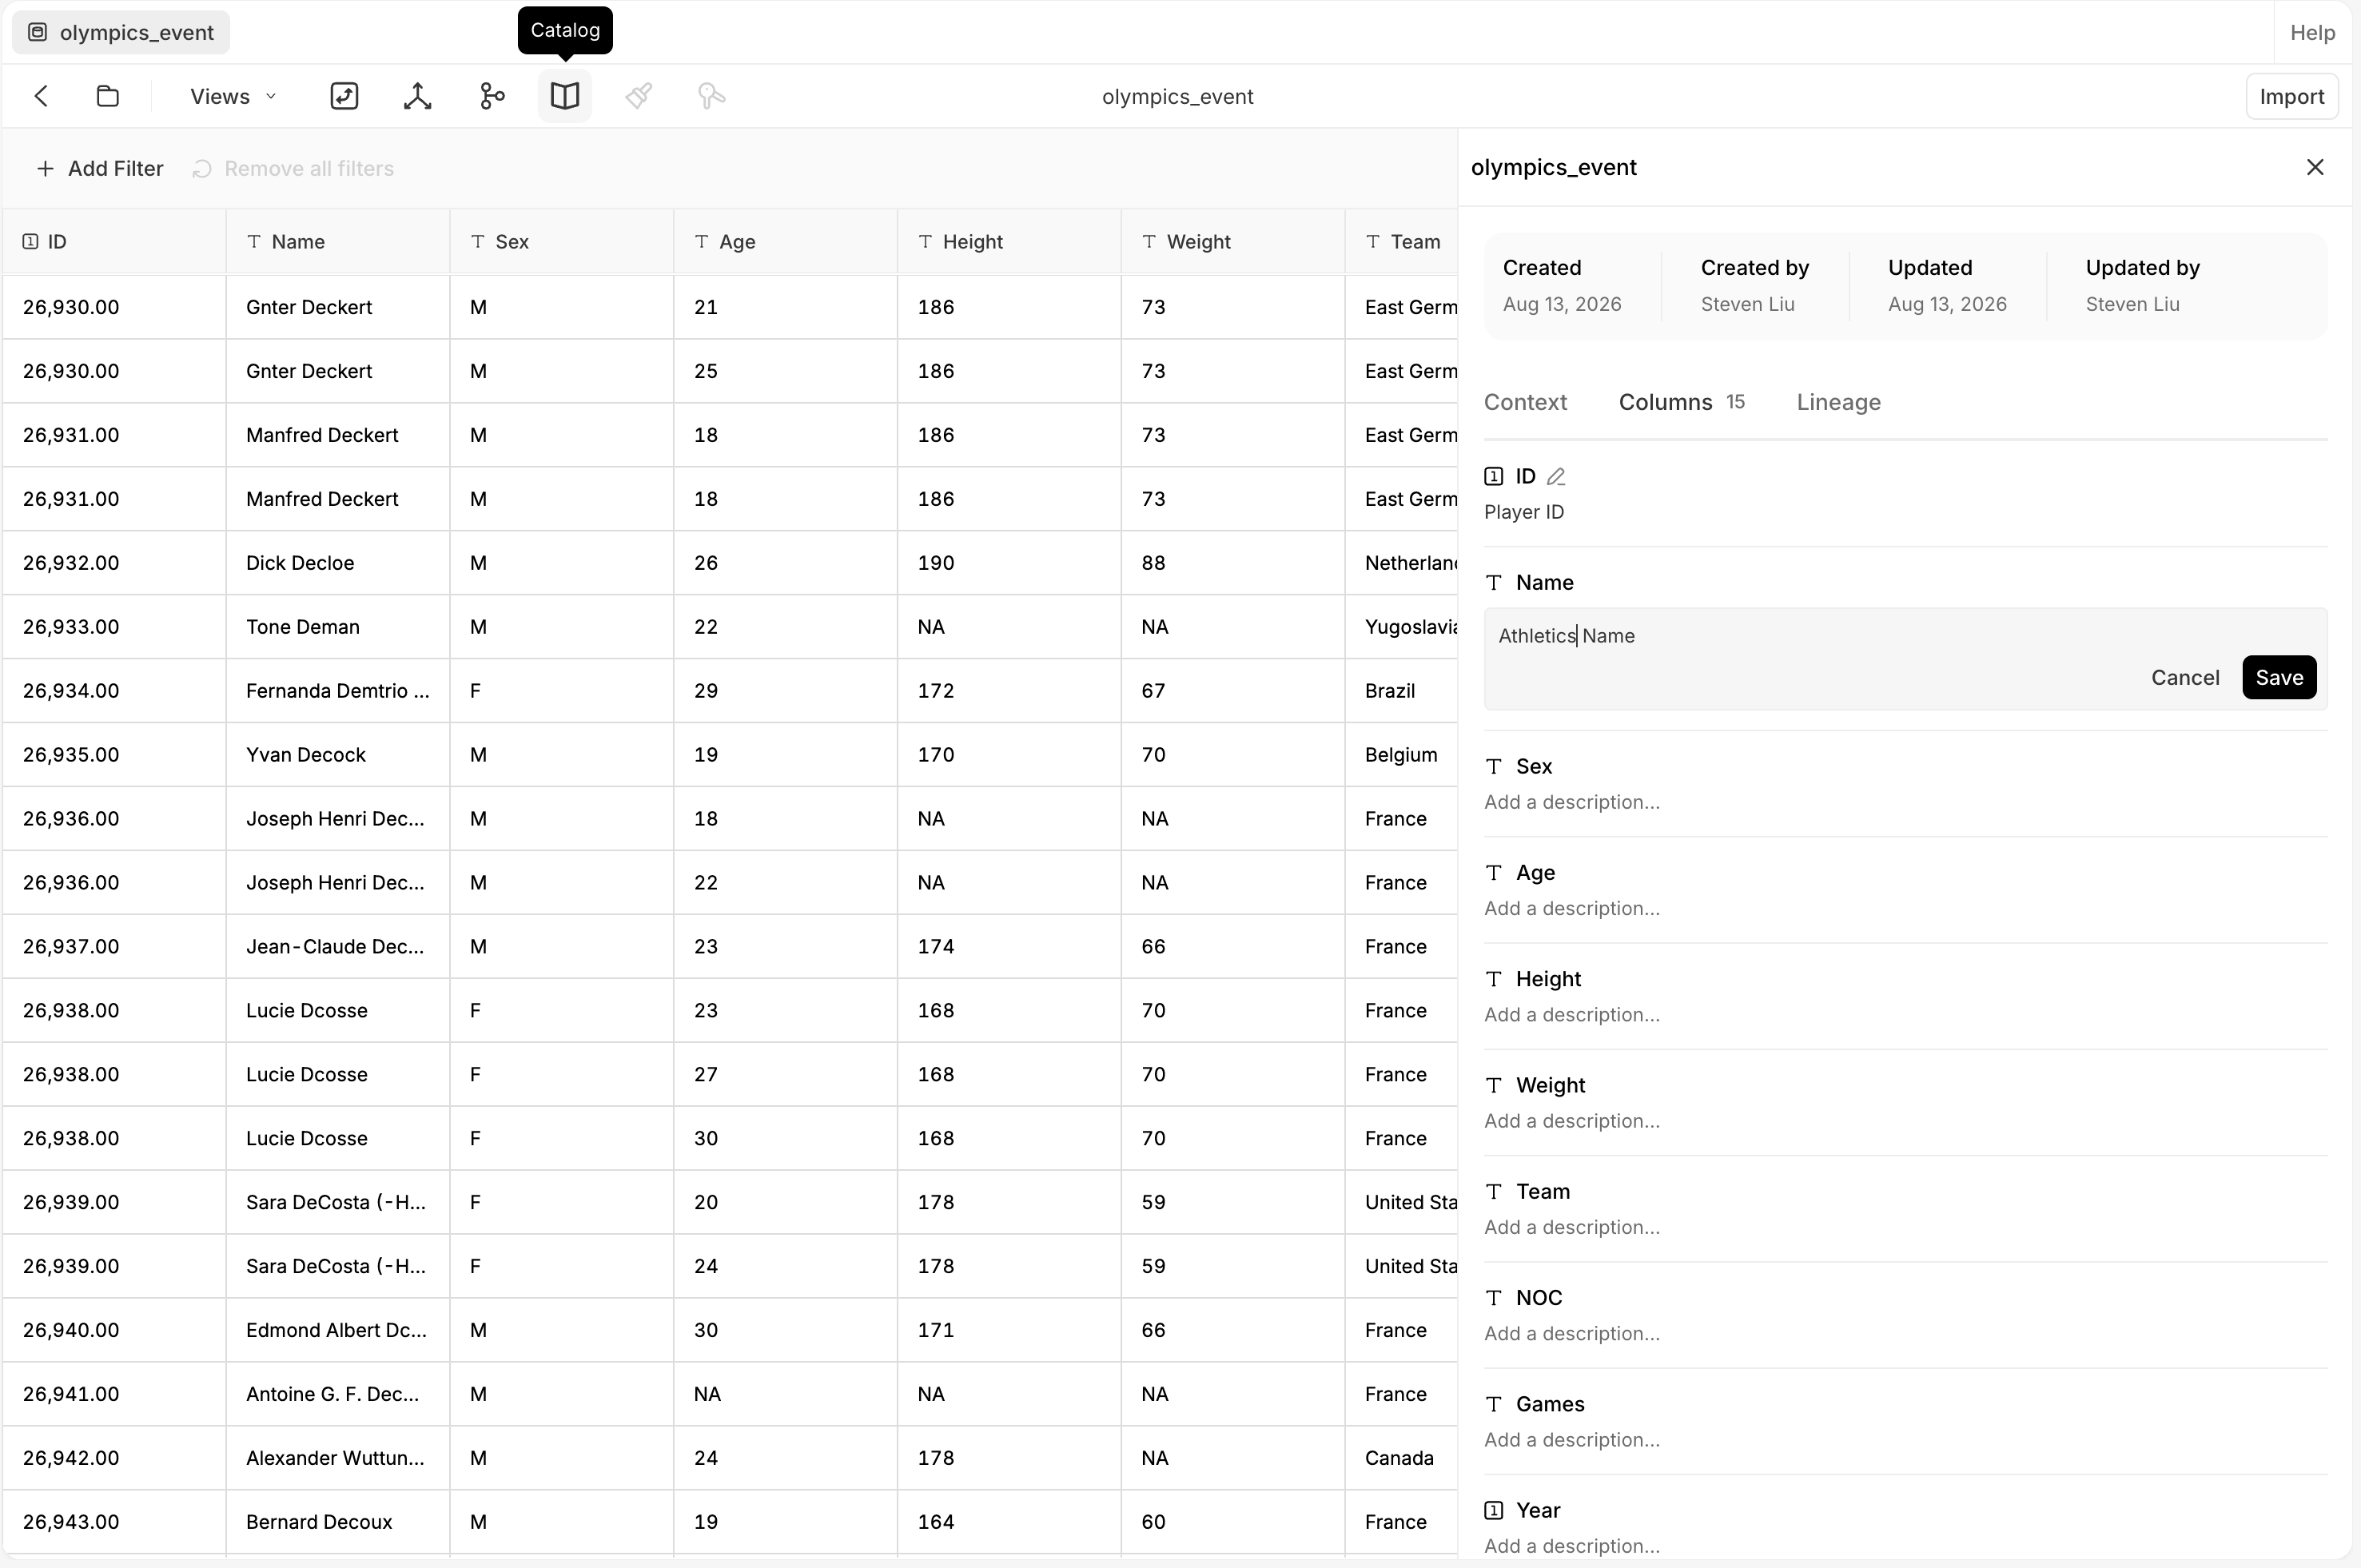
The Catalog panel for the table 'olympics_event', showing Created / Created by / Updated / Updated by metadata and Context, Columns (15), and Lineage tabs. The Columns tab lists each column with an editable description — ID reads 'Player ID', Name is being edited with a description field and Cancel / Save, and others (Sex, Age, Height, Weight, Team, NOC) show 'Add a description...'.

The Catalog panel — Columns tab

Lineage

Open Lineage from the table toolbar (or the Catalog panel’s Lineage tab) to see what a table is built from and what depends on it — a graph linking source tables to the calculation tables and views derived from them. Expand a node’s View columns for column-level lineage, and search for a table or column.
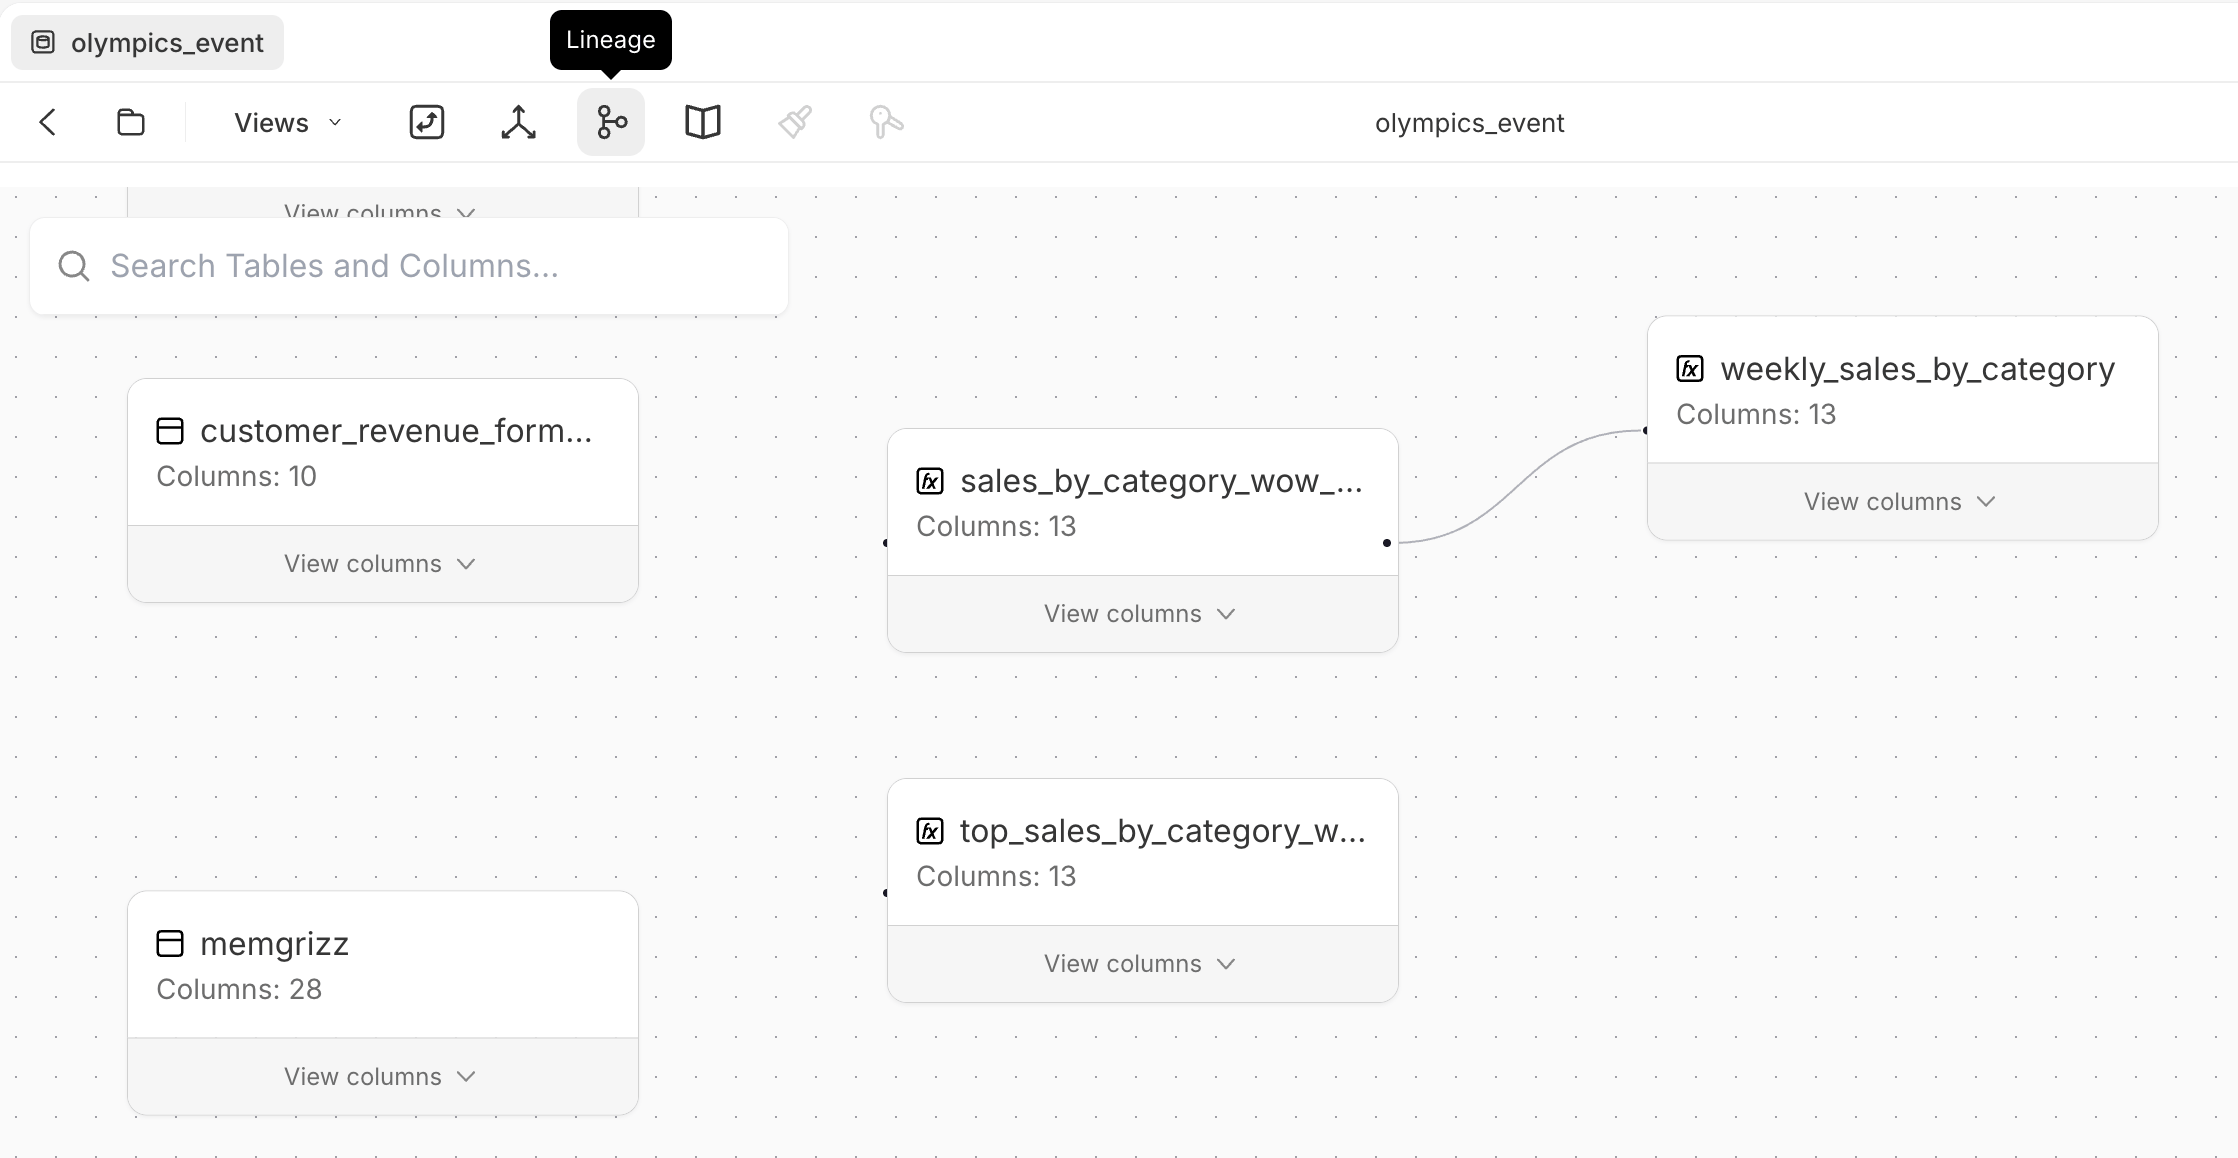
A lineage graph for 'olympics_event' with a 'Search Tables and Columns' box and several table nodes — customer_revenue_form..., memgrizz, and the calculation tables (fx) sales_by_category_wow..., top_sales_by_category_w..., and weekly_sales_by_category — each showing its column count and a 'View columns' expander, with a line connecting sales_by_category_wow... to weekly_sales_by_category.

Table lineage

Delete a table

There’s no delete action in the Tables UI. A table row’s actions are Open data catalog, Open in new tab, Copy link, Find in folder, and Rename — none of them delete. Deleting a table is API-only (see Via the API) or done through admin tooling, and can’t be undone.