A report (.sdoc) is an exec-ready analysis Addison writes from your data — from recurring business reviews to ad-hoc deep dives. Each report mixes written insights, data tables, and charts, and every finding is backed by citations that trace it to the underlying data. Reports are an artifact and live inside a project.
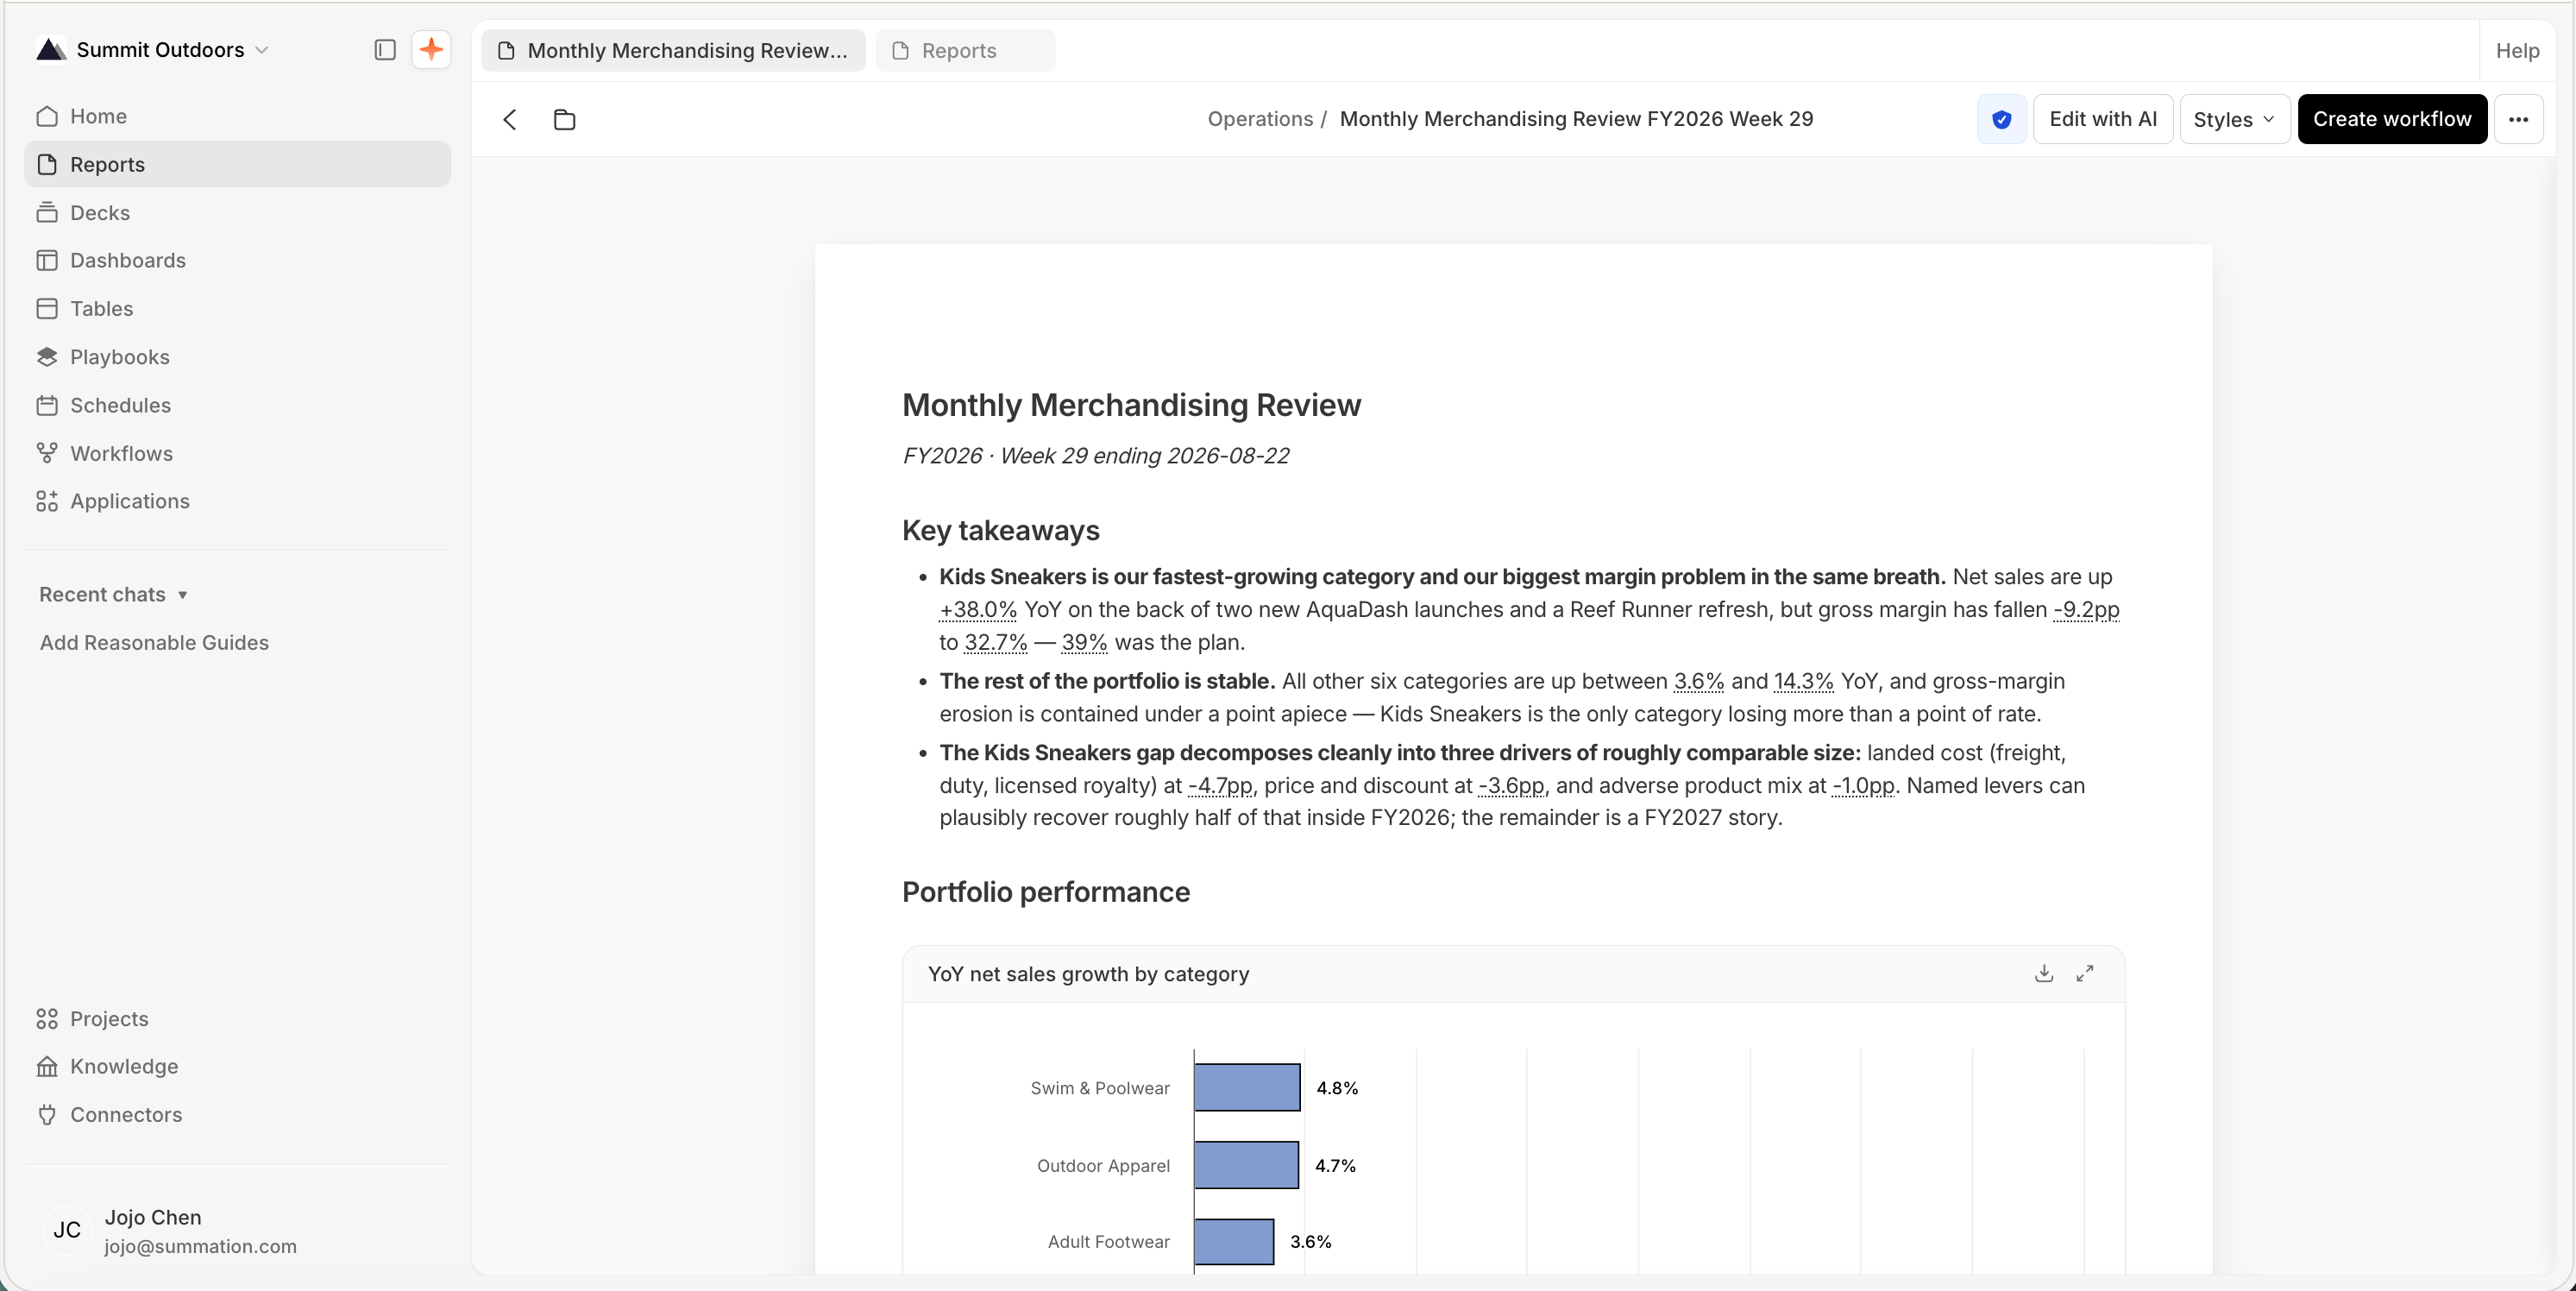
An example report titled 'Monthly Combined Ratio Executive Review' for reporting period May 2025–April 2026. It has an Executive Summary with metrics shown as underlined citations (combined ratio 91.6%, gross written premium $1.2B, loss ratio 62.9%), a 'Key Actions and Outlook' section with bulleted priorities, and a 'Combined Ratio Trend' section with a line chart comparing Actual vs Plan vs Prior Year across the twelve months.

An example report — written analysis with data citations, key actions, and charts

Create a report

You can start a report a few ways — each hands Addison a prompt and streams the result.Create a report from the Reports page: click Create report (top-right of /report). You can also run a playbook that generates a report each run.
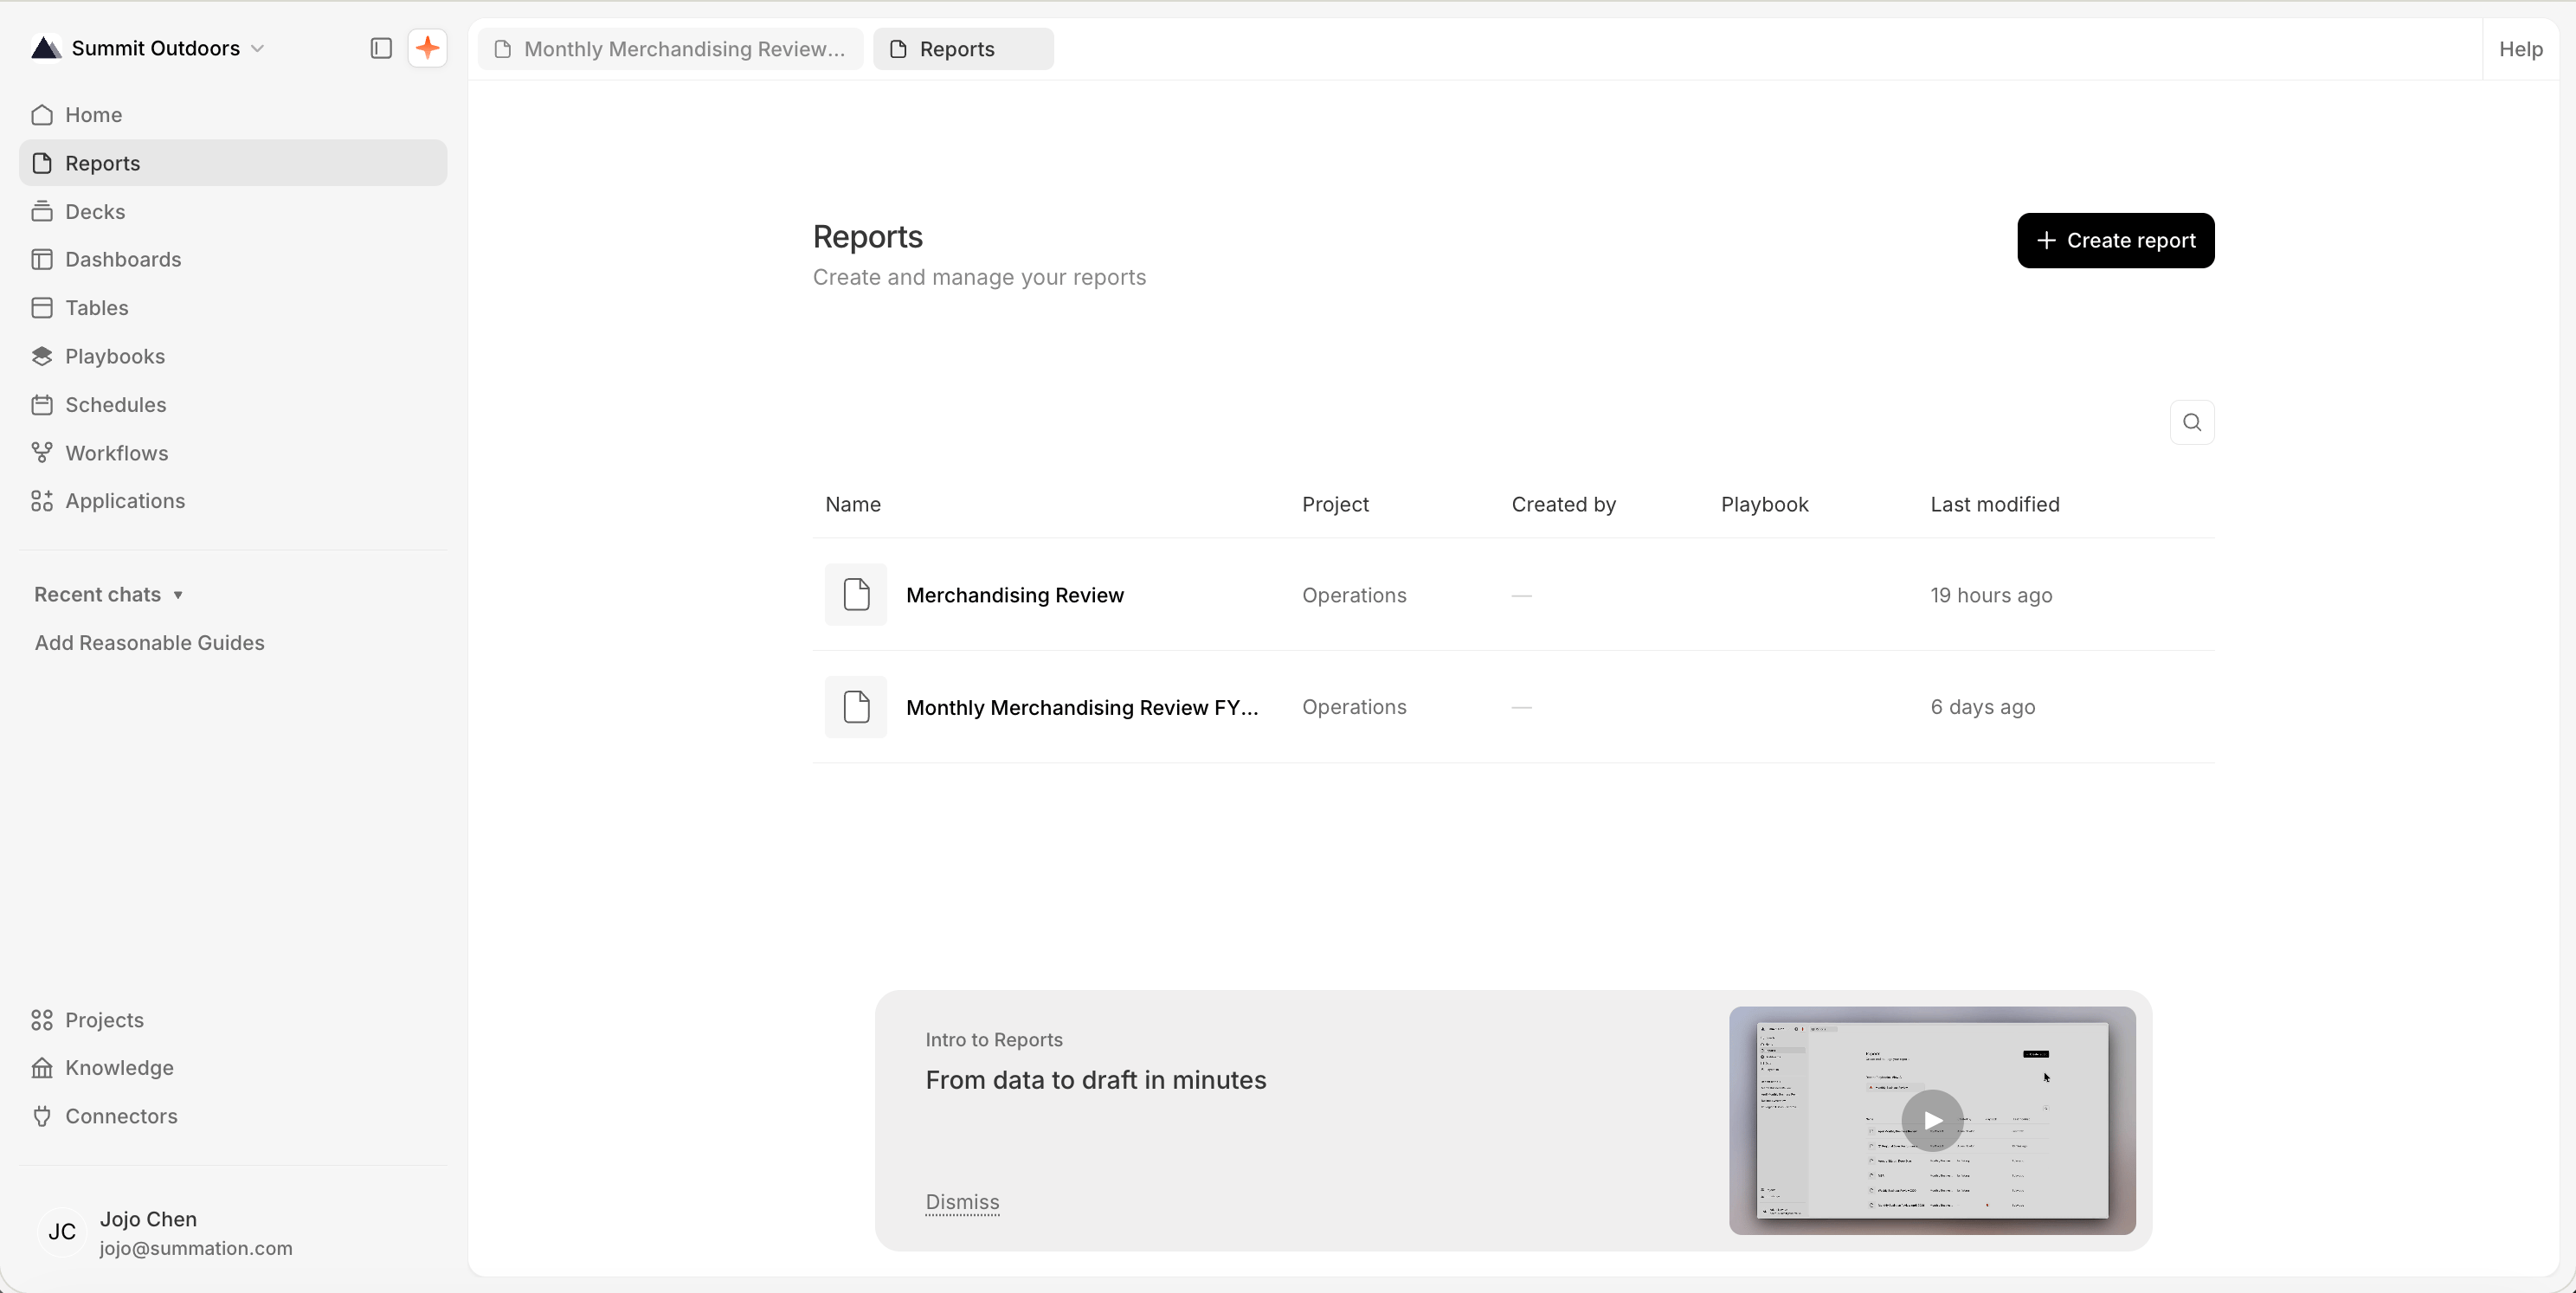
The Reports page at /report titled 'Reports — Create and manage your reports', with a Create report button in the top-right and a search box. A table lists reports with columns Name, Project, Created by, Playbook, and Last modified; rows are Olympics-themed demo reports such as 'Olympics Player - Korea (All Years)', 'Olympics Medals Leaderboard - 2012', and 'Olympics Player - Japan (All Years)', each with a project, author, and relative timestamp. An 'Intro to Reports — From data to draft in minutes' onboarding card with a video thumbnail and Dismiss link sits at the bottom.

Create report on the Reports page

A playbook run dialog for the 'Weather Report' playbook — 'Generate a simple weather report using mock data for a given city', a Recent report link, Duration 1 min, and Run playbook / Schedule buttons, with the note 'This will run the playbook and create its outputs in the project.'

Run a playbook to generate a report

Two more ways: from a project’s Create → Report (see Create artifacts from project), or by asking Addison in a chat (see Creating artifacts).

Find and open reports

The Reports page (/report, shown above) lists your reports across all projects, with columns for Name, Project, Created by, Playbook, and Last modified, plus search. Click one to open it. Reports also appear as .sdoc folder packages in their project’s file browser.

Rename and delete

A report is a .sdoc folder package, so you rename or delete it like any file — from the project file browser’s menu. Each report row on the Reports page (/report) also has a trailing menu with Rename and Delete. Deleting can’t be undone.
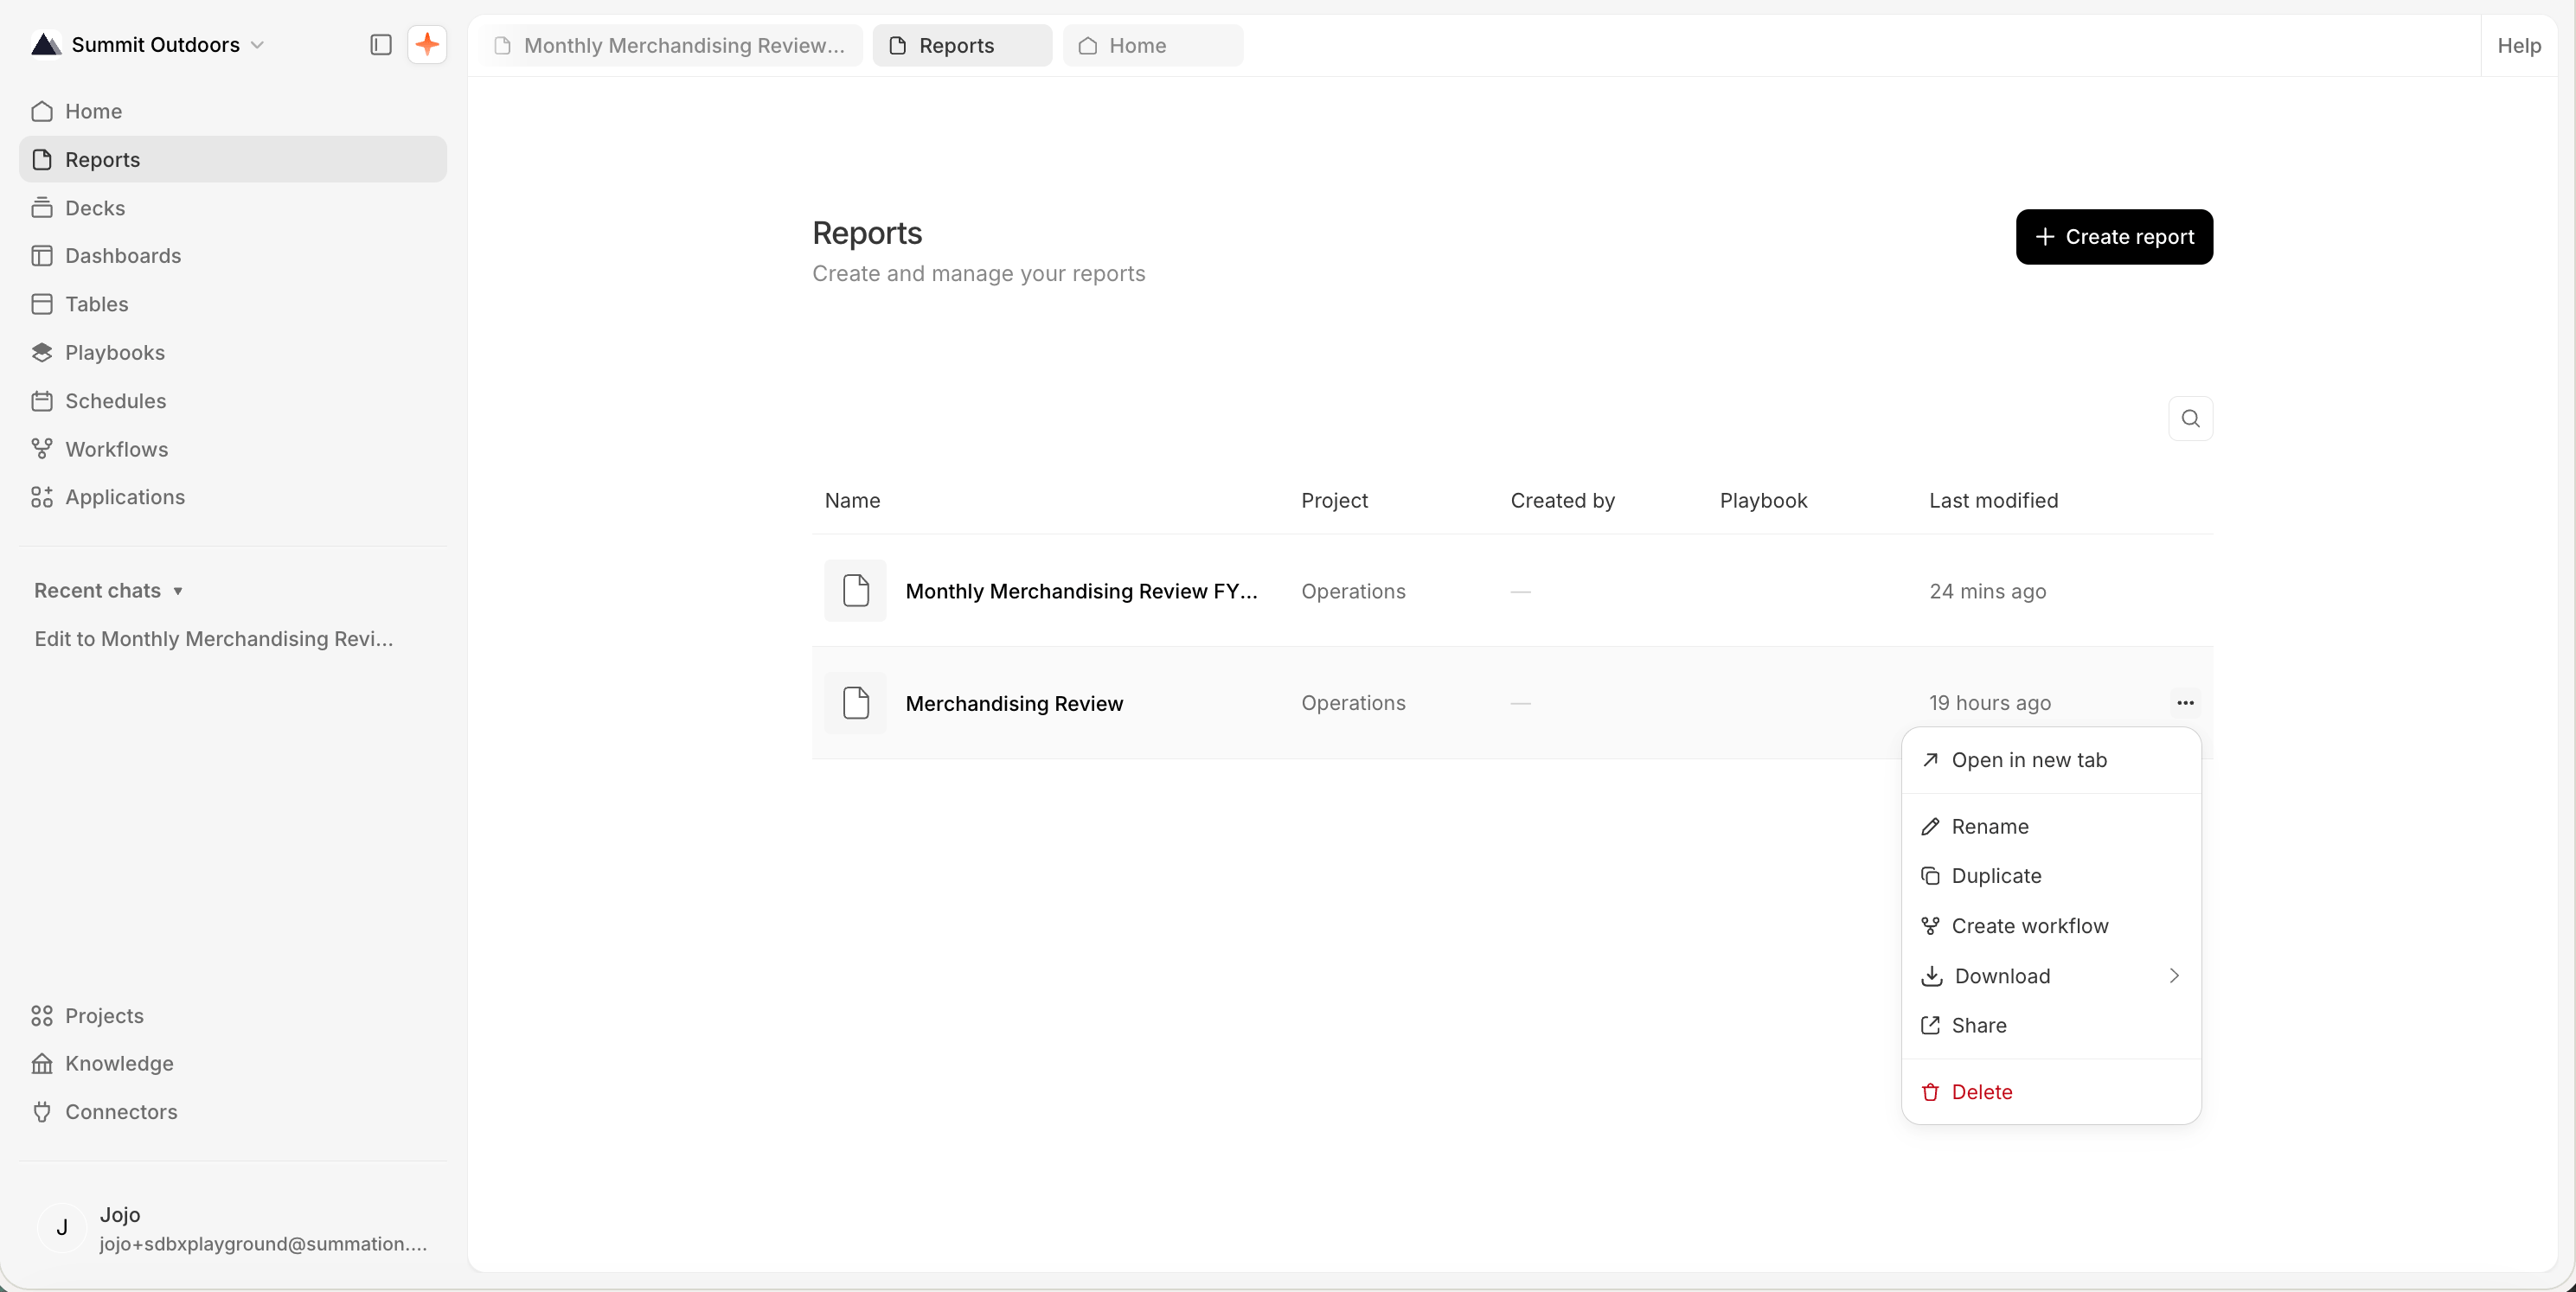
A report row's ⋯ menu on the Reports list, open with: Open in new tab, Rename, Duplicate, Download (with a submenu), Share, and Delete (in red).

A report's ⋯ menu on the Reports list

Verify a report

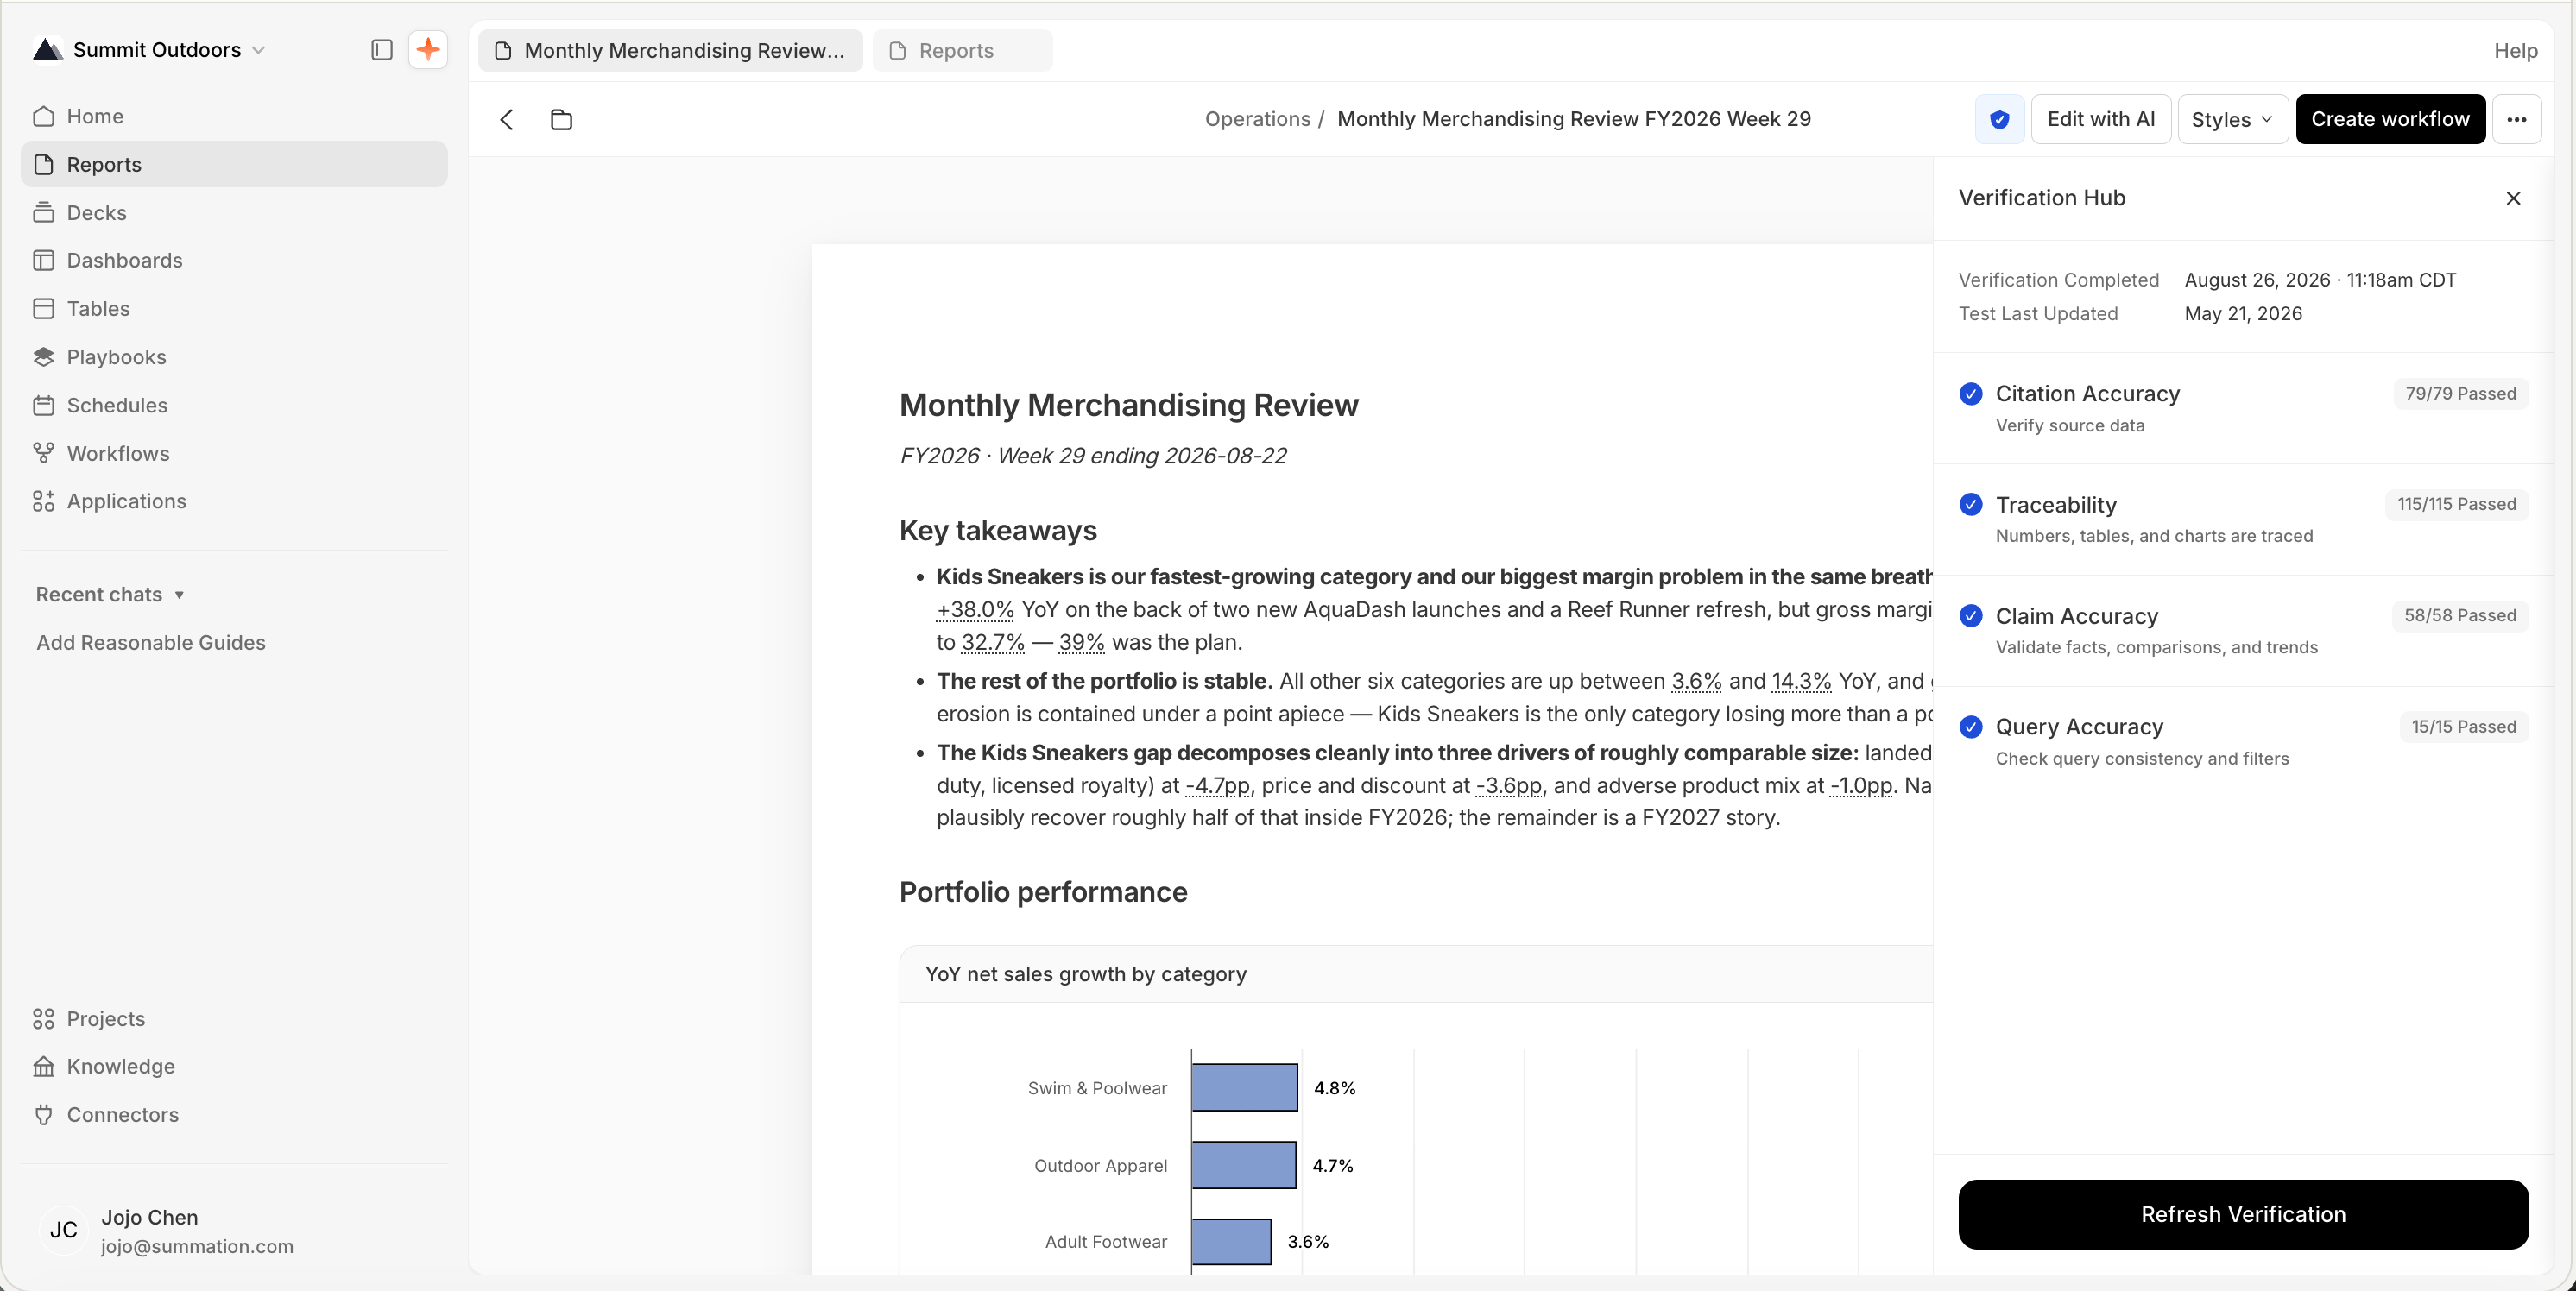
Verification is an automated audit of the report’s accuracy. Click the verification badge (shield) in the toolbar to open the Verification Hub, then Verify to run it — the button reads Refresh Verification after the first run — streamed with progress. It reports four dimensions, each showing how many checks passed:Behind these, the underlying test set also runs an advisory quality review that surfaces suggestions without affecting the pass/fail badge.If you edit the report after verifying, the Hub flags it (“Edits have been made — refresh verification”). The toolbar verification badge shows the current state:
The Verification Hub panel for a report. It shows 'Verification Completed' with a date, 'Test Last Updated' with a date, and a yellow banner 'Edits have been made. Refresh verification for the latest update.' Below are four dimensions, each with a description and a pass count — Citation Accuracy (Verify source data) 22/22 Passed, Traceability (Numbers, tables, and charts are traced) 38/38 Passed, Claim Accuracy (Validate facts, comparisons, and trends) 23/23 Passed, and Query Accuracy (Check query consistency and filters) 6/6 Passed. The report toolbar above shows the shield badge, Edit with AI, Styles, and a ⋯ menu.

The Verification Hub

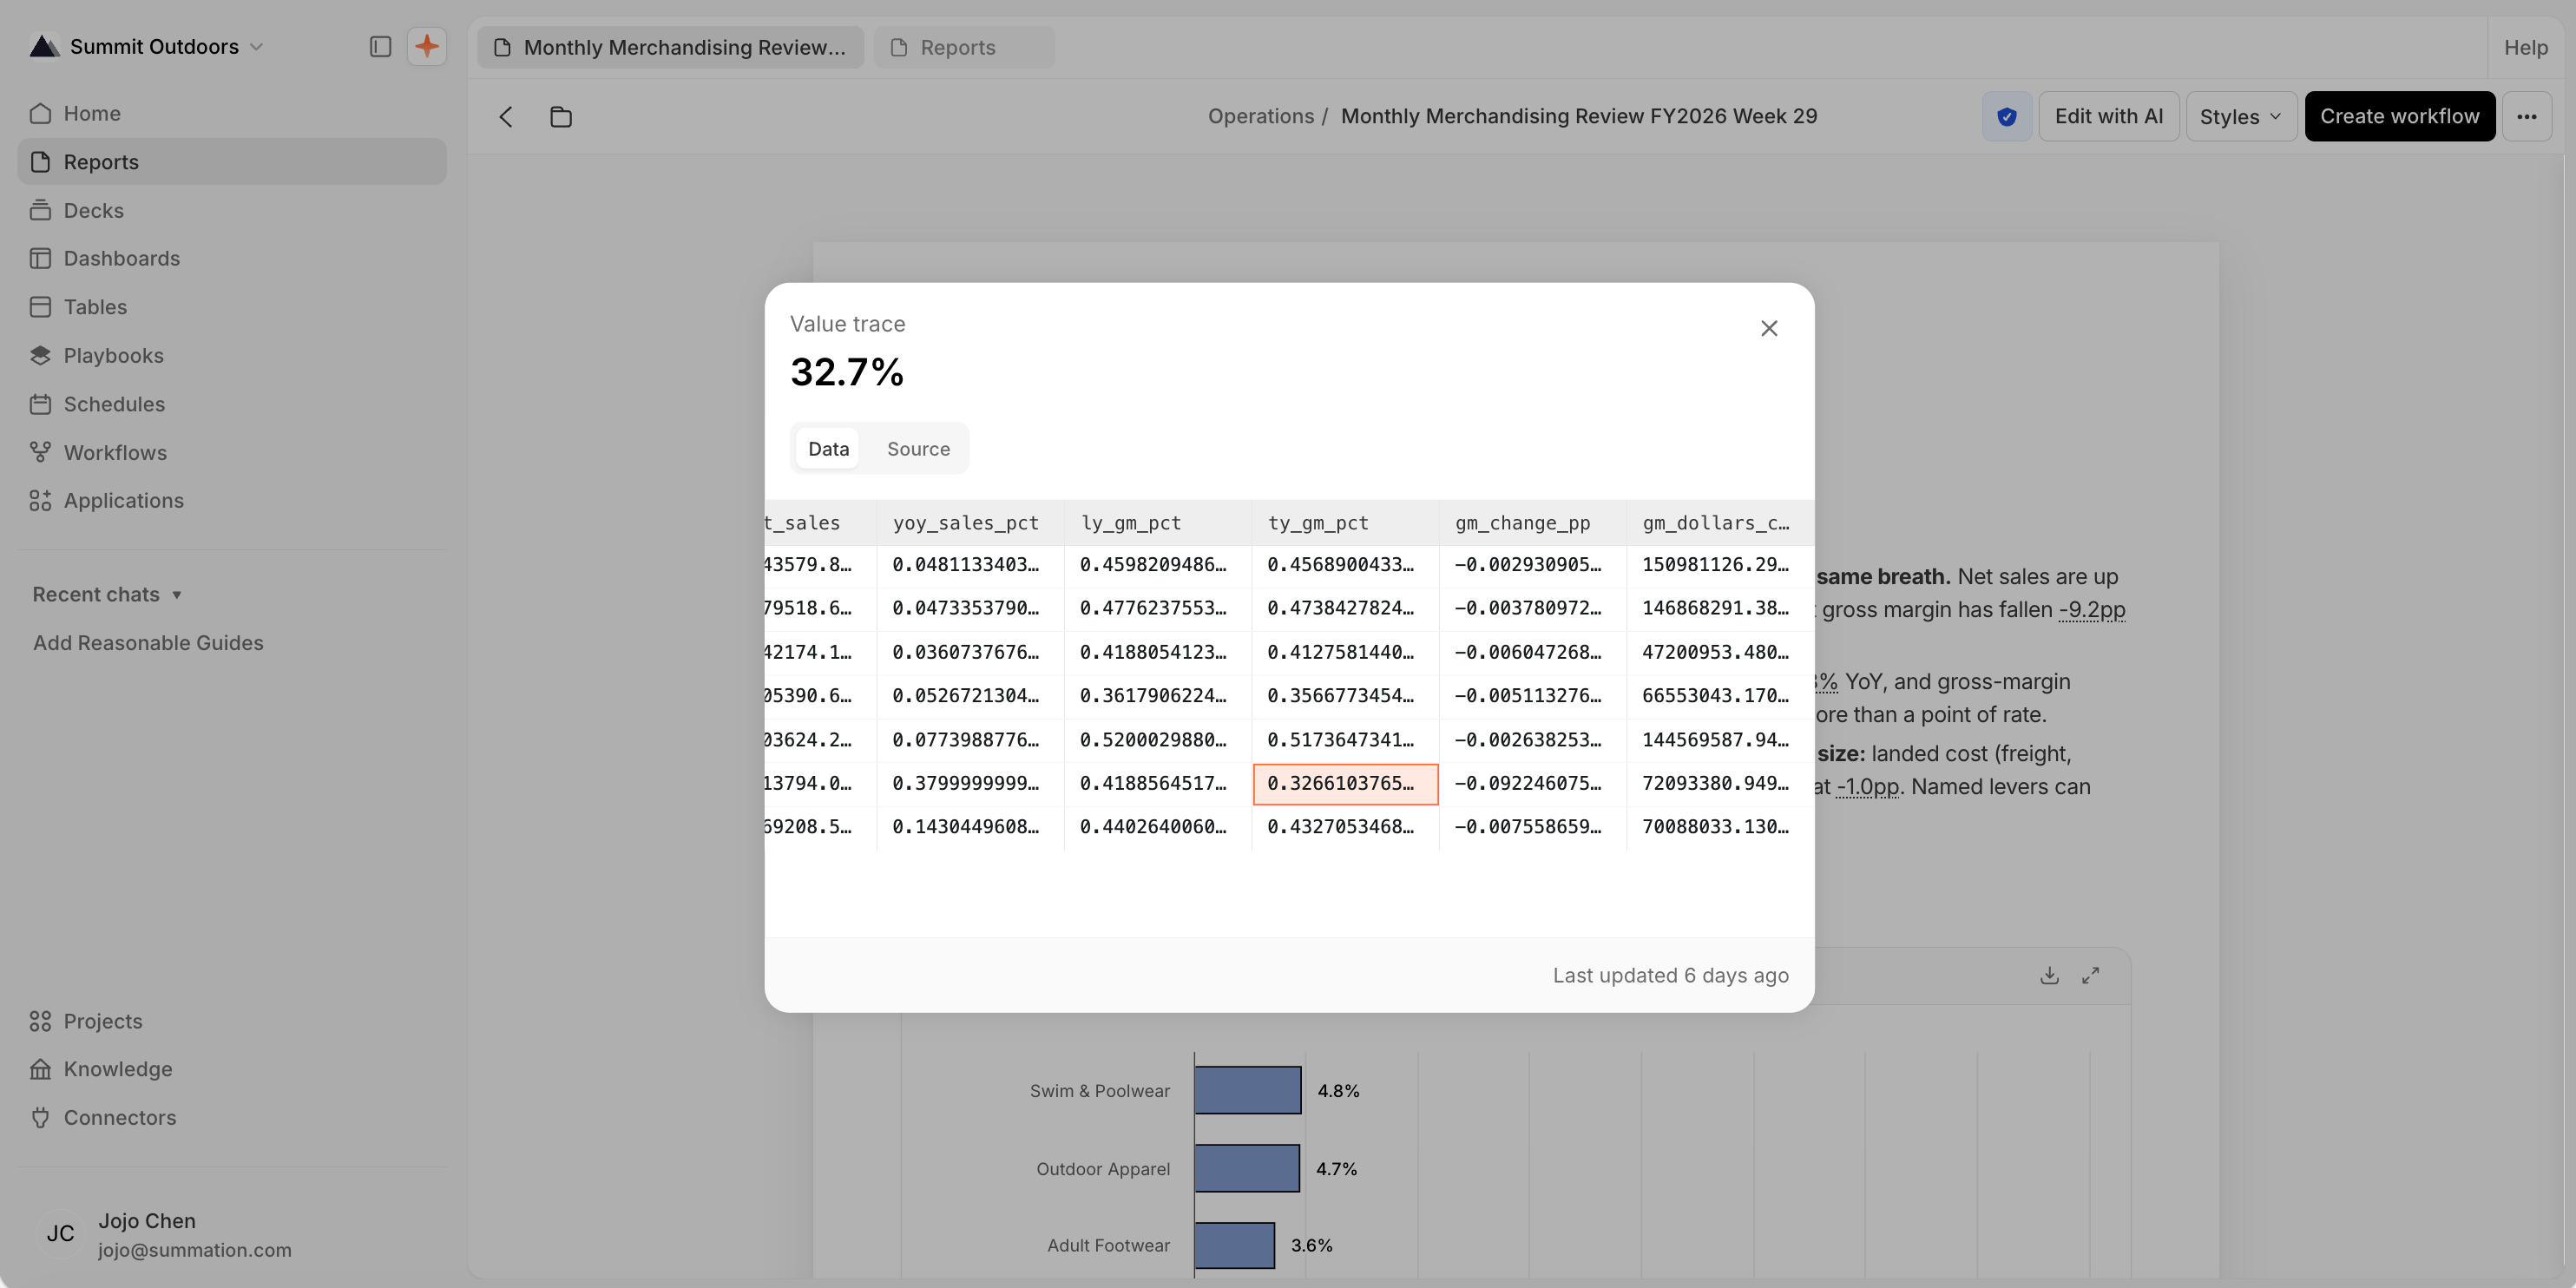
Traceability in action. Every figure Addison cites is underlined — click one to open a Value trace showing the exact query result and the data cell behind it. Traceability is the verification check that all of these resolve to real source data.
A 'Value trace' popover opened from an underlined figure ($6.85B) in a report. It shows the source query result as a table with columns segment, revenue, share_of_total, and yoy_growth; the Commerce revenue cell (6850000000) is highlighted as the exact source of the $6.85B citation.

Value trace — click a cited figure to see its source

Ask and edit with Addison

A report’s body is read-only — you don’t type into it. Instead, highlight any section (text, a chart, or a table) to get a floating toolbar with two actions:
  • Ask — ask Addison a question about the highlighted spot (opens an “Ask Addison” box).
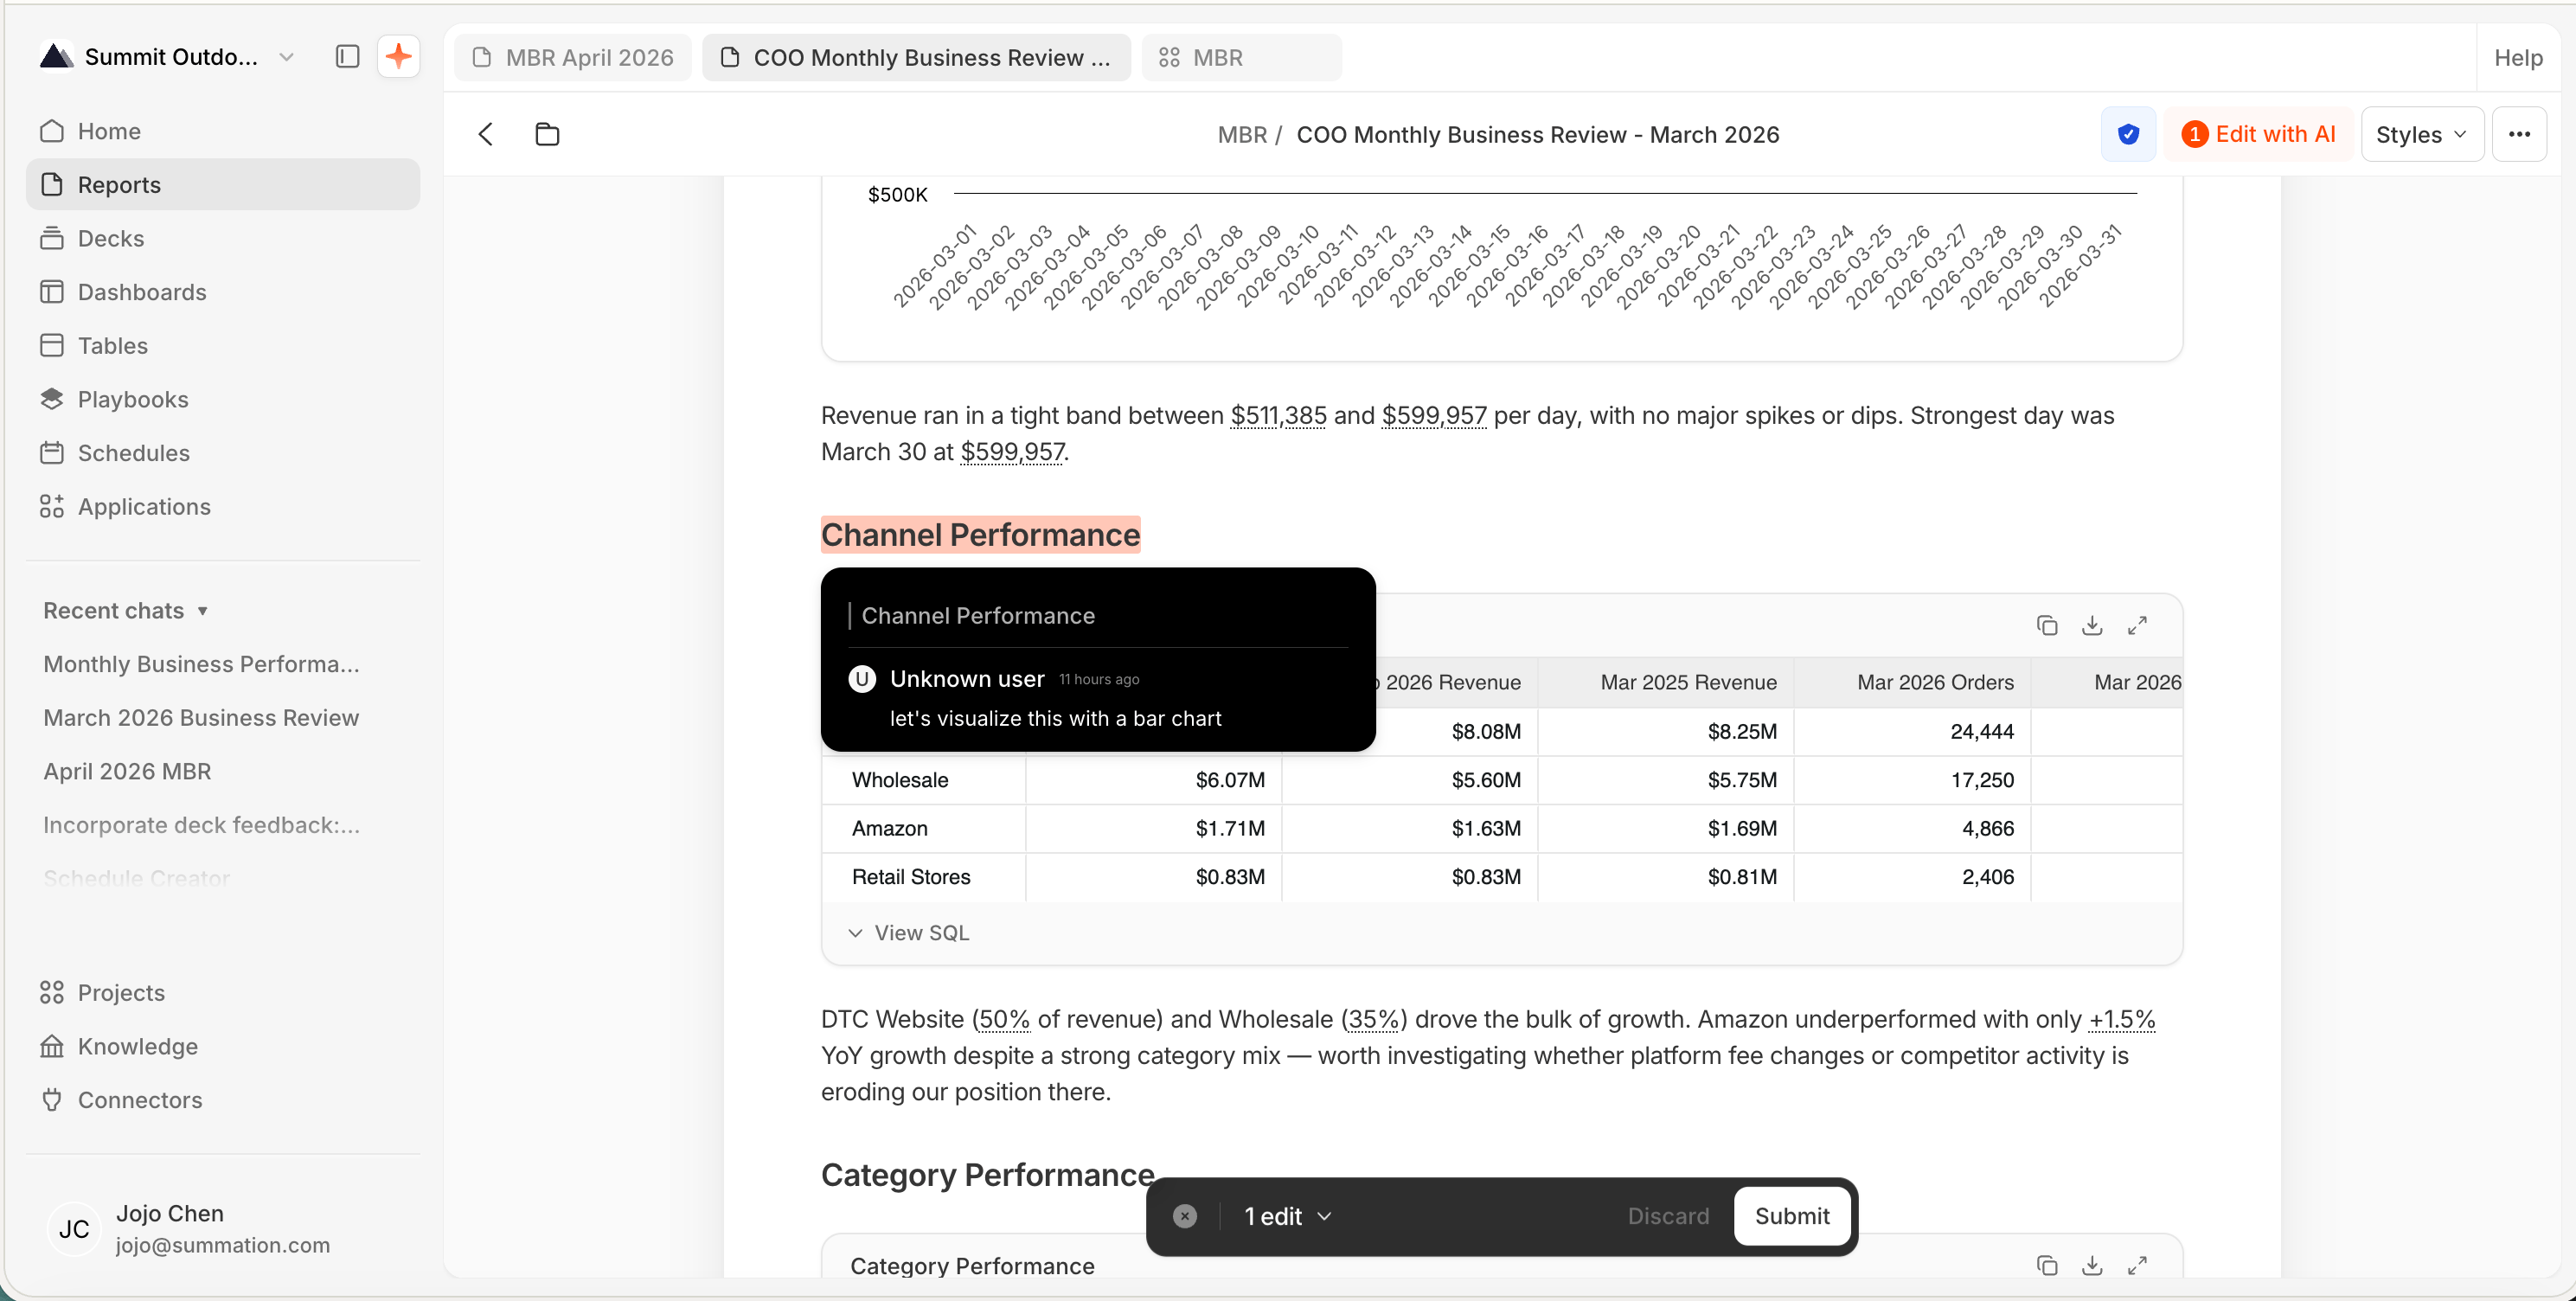
  • Edit with AI — describe a change and Addison rewrites that part (opens a “Describe the edit…” box). You can also toggle Edit with AI in the toolbar to edit anywhere in the report.

You can also run /incorporate-feedback in chat to apply the Edit with AI feedback threads left on the report in one pass. It acts only on those Edit-with-AI feedback threads, not on ordinary comments — @-mentioning Addison in a comment spawns its own reply instead.
A floating toolbar over a highlighted sentence in a report, offering two actions: 'Ask' (with a sparkle icon) and 'Edit with AI' (with a pencil icon).

Highlight a section to Ask or Edit with AI
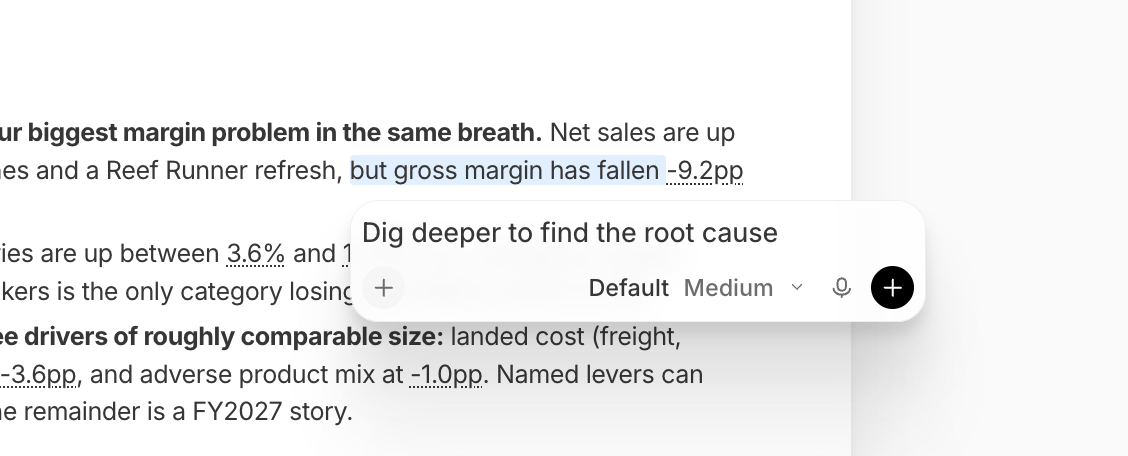
An 'Ask Addison' input box that appears under a highlighted sentence in the report, with a + button to attach context.

Ask — question the highlighted spot

A comment/edit popover on a highlighted paragraph of the 'Olympics Medals Leaderboard — 2012' report: it quotes the selected sentence and shows a queued edit request — 'Can we add a chart showing total medal comparison of the top 10 countries?' — attributed to a user's initials avatar, with a Remove control. Behind it the report shows a medal table (country, Sports, Gold, Silver, Bronze, Total), and a '1 edit · Discard · Submit' bar sits at the bottom.

Edit with AI — describe the change

Styles

Click Styles in the toolbar to restyle how a report looks. Pick a built-in style like Editorial or Pulse (including a dark theme), or a Custom style. The content stays the same; only the presentation changes.
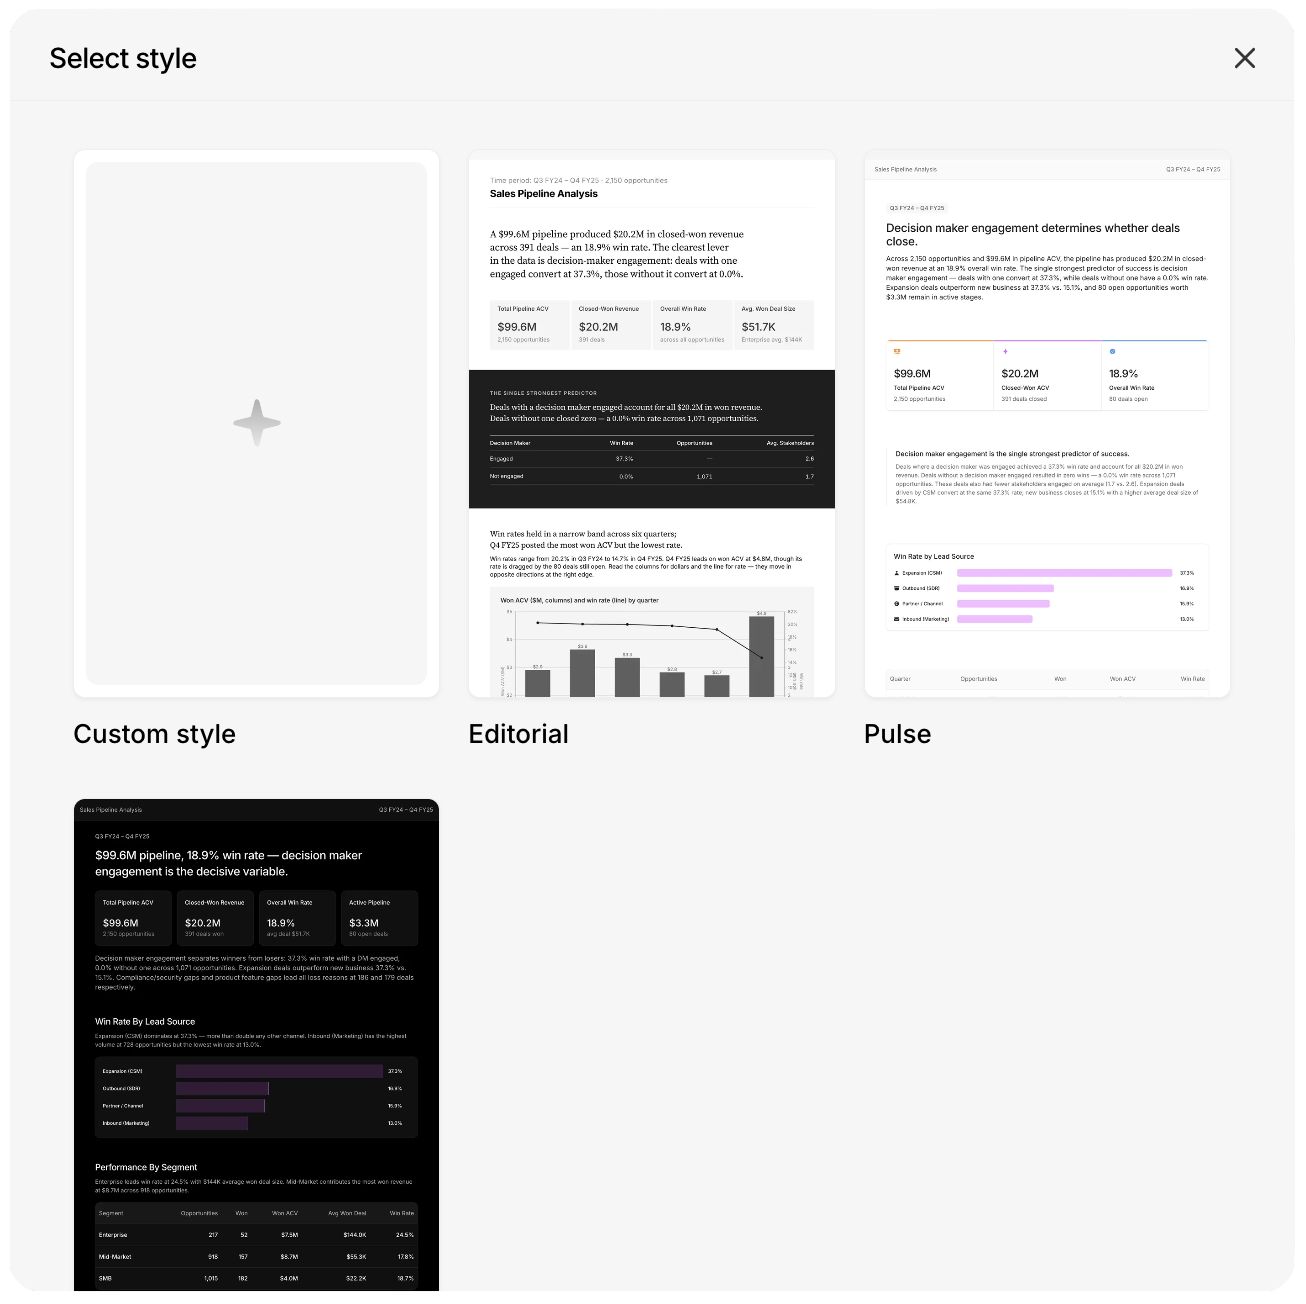
A 'Select style' modal showing style options as preview cards: Custom style (blank with a plus), Editorial (a light, magazine-like layout), Pulse (a light layout with metric cards), and a dark-themed style.

Select a report style

Version history

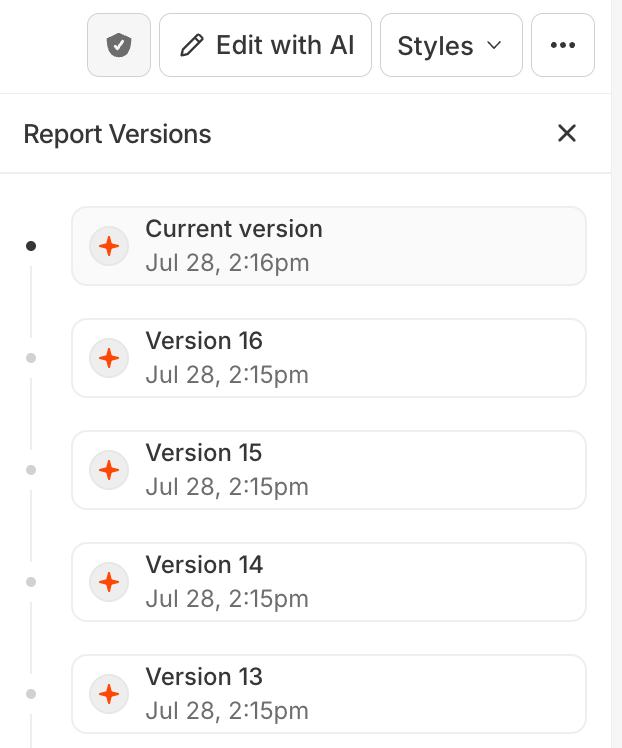
Every AI edit and manual change is saved as a version. Open Version History to see the full timeline and open an earlier version. Each version row has a menu with Rename Version and Revert Version (reverting rolls the report back to that version and shows a “Reverted to Version N” toast). While you’re viewing an older version, a “Viewing version” banner appears with a View latest link back to the current one, and editing, sharing, and export are disabled until you return to the latest.
The 'Report Versions' panel listing the Current version and Version 16 down to Version 3, each with a timestamp. A sparkle icon marks AI-generated versions and an initial avatar marks manual saves.

Report Versions timeline

Share and publish

Open a report’s menu → Share, then Publish to create a view-only link for your organization — viewers can sign in or create an account to open it. Unpublish at any time.
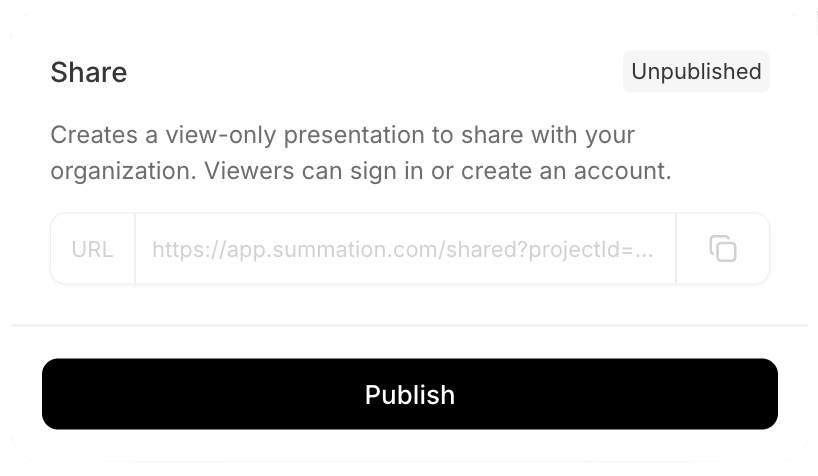
The report Share dialog labeled 'Unpublished'. It explains it 'Creates a view-only presentation to share with your organization. Viewers can sign in or create an account.', shows a URL field (https://app.summation.com/shared?projectId=…), and a Publish button.

Publish a view-only link

Download

Open a report’s menu → Download and choose PDF or Word (.docx).
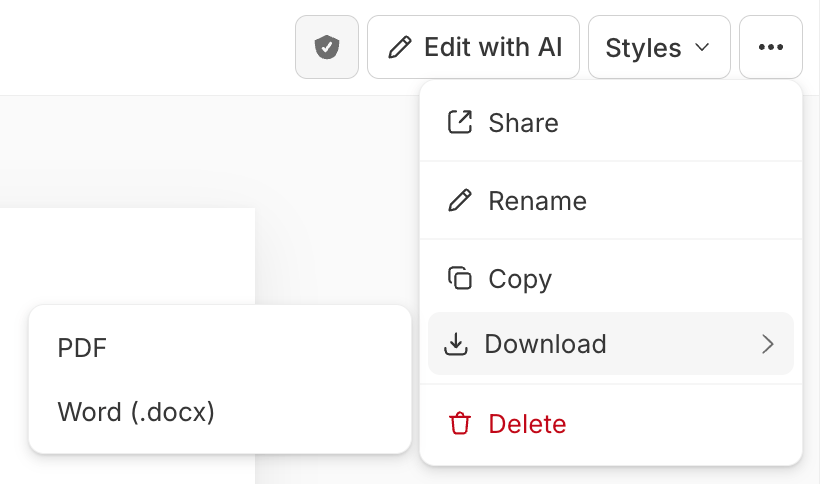
A report's ⋯ menu open with Share, Rename, Copy, Download (highlighted, expanding to a submenu showing PDF and Word (.docx)), and Delete; the toolbar above shows the verification badge, Edit with AI, Styles, and the ⋯ button.

Download → PDF or Word