Decks take the analysis you already have and turn it into something you can stand up and present, without anyone rebuilding it slide by slide in PowerPoint. Every figure on a slide traces back to the data behind it, so the deck holds up in the room where someone questions a number. A deck (.sdeck) is a presentation Addison builds from your data: board updates, quarterly business reviews, launch plans, metric deep dives. Each slide combines a written takeaway with charts, tables, and data views, and decks download as real, editable PowerPoint. Decks are an artifact and live inside a project.
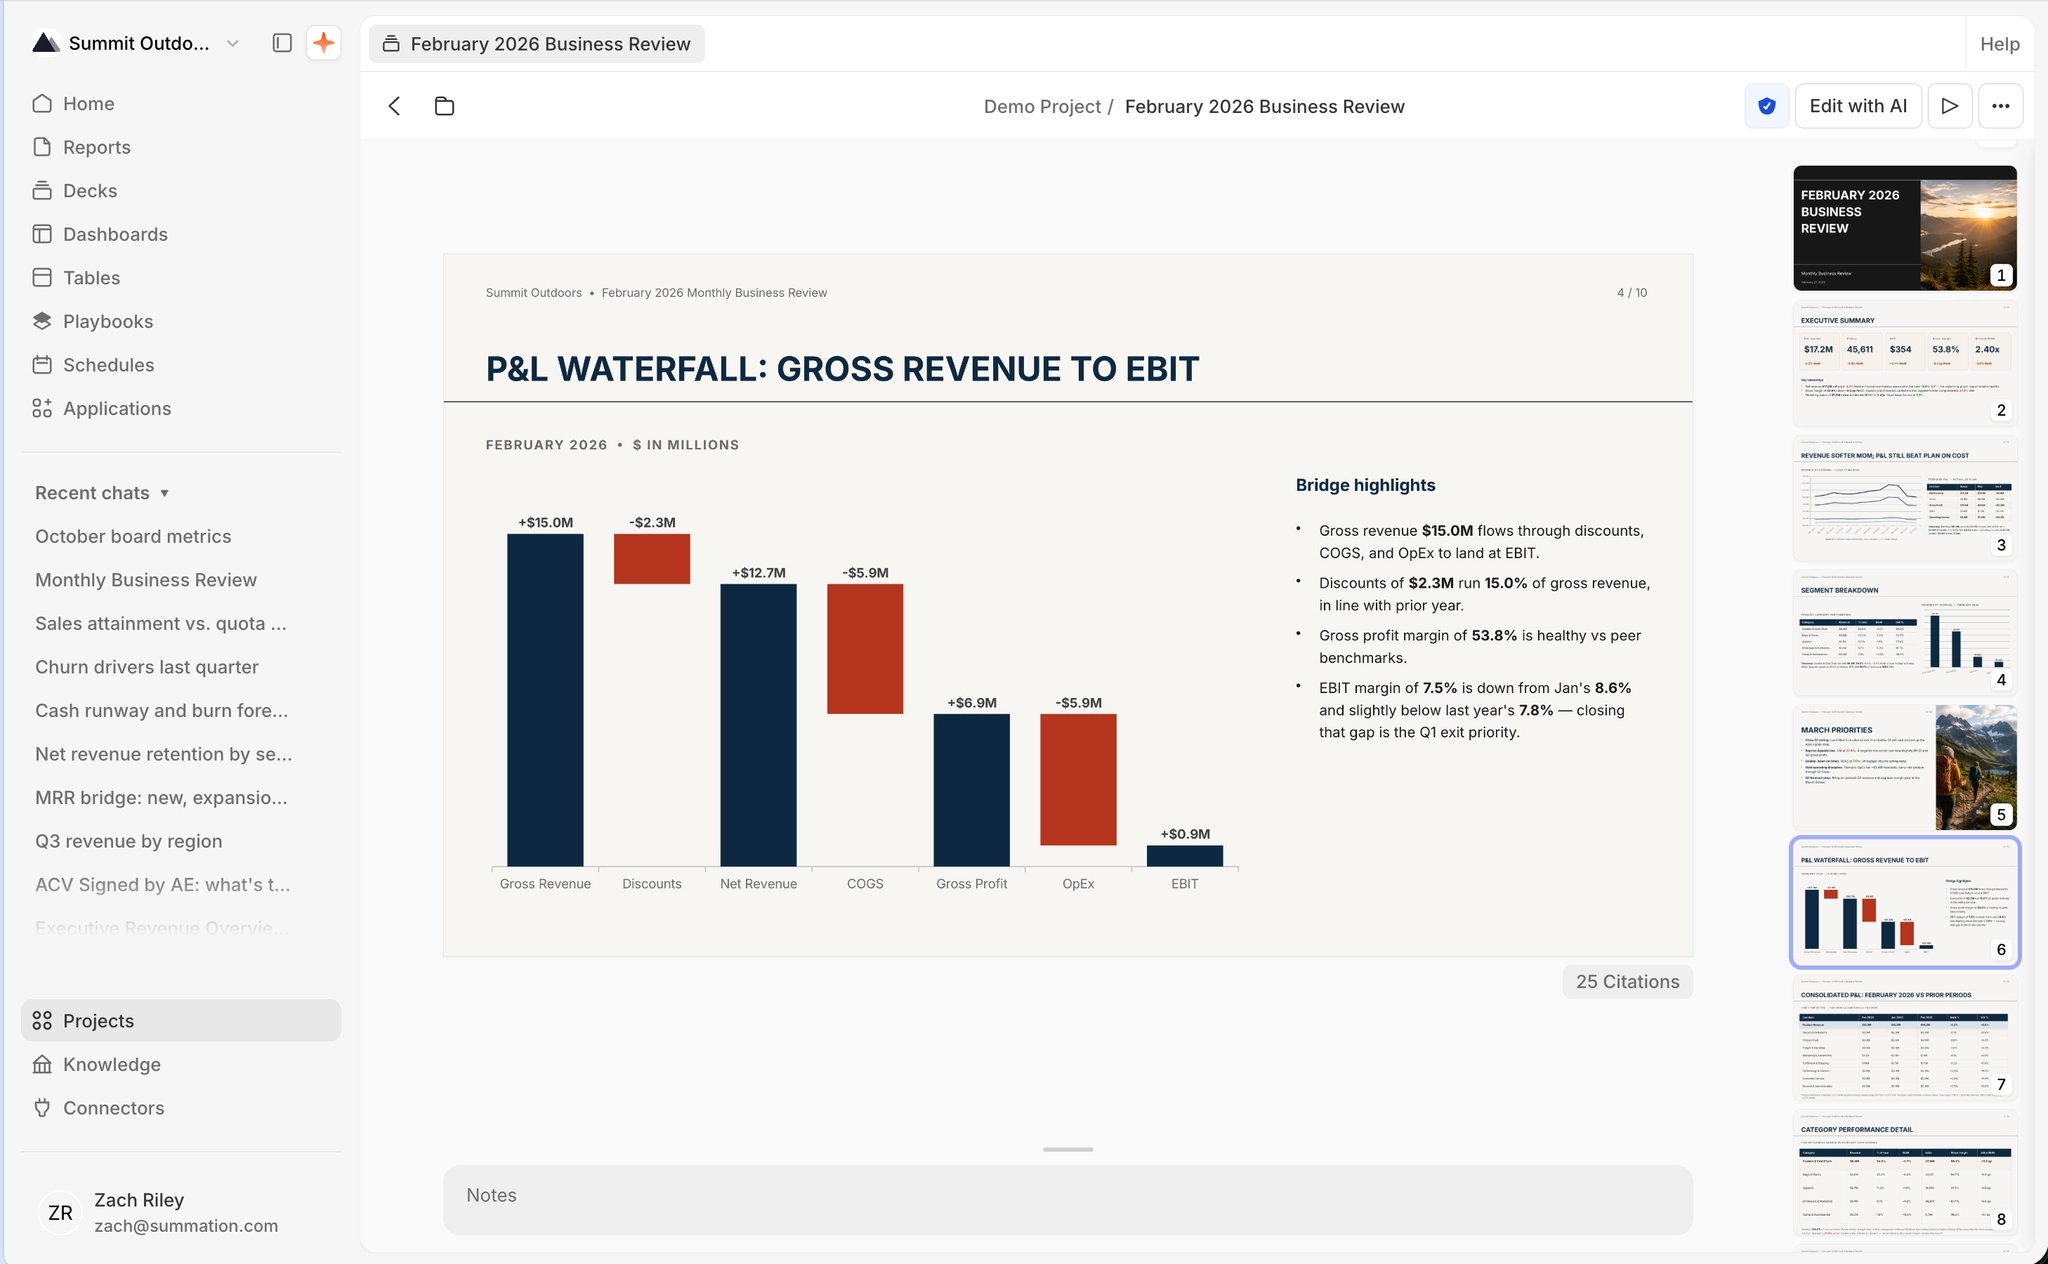
A deck open in the viewer, breadcrumbed 'Demo Project / February 2026 Business Review'. The toolbar at the top-right has a shield verification badge, Edit with AI, a play button for presentation mode, and a ⋯ menu. Slide 4 of 10 is titled 'P&L Waterfall: Gross Revenue to EBIT' with a waterfall chart (Gross Revenue +$15.0M, Discounts -$2.3M, Net Revenue +$12.7M, COGS -$5.9M, Gross Profit +$6.9M, OpEx -$5.9M, EBIT +$0.9M) and three 'Bridge highlights' bullets. A '25 Citations' button sits below the slide, and a numbered thumbnail rail runs down the right side with slide 4 selected.

An example deck: chart, P&L table, and a citation for every figure

Decks are app-only today: there are no deck endpoints. You can still have Addison build one in a project; you just cannot read or edit its structure programmatically. See API coverage.

Create a deck

There are several ways to start a deck. Each hands Addison a prompt and generates the slides in the background. From the Decks page, click Create deck (top-right), then describe the deck. Suggestion chips get you started: Board update, Quarterly review, Launch plan, Metric deep dive. You can also run a playbook that produces a deck on every run.
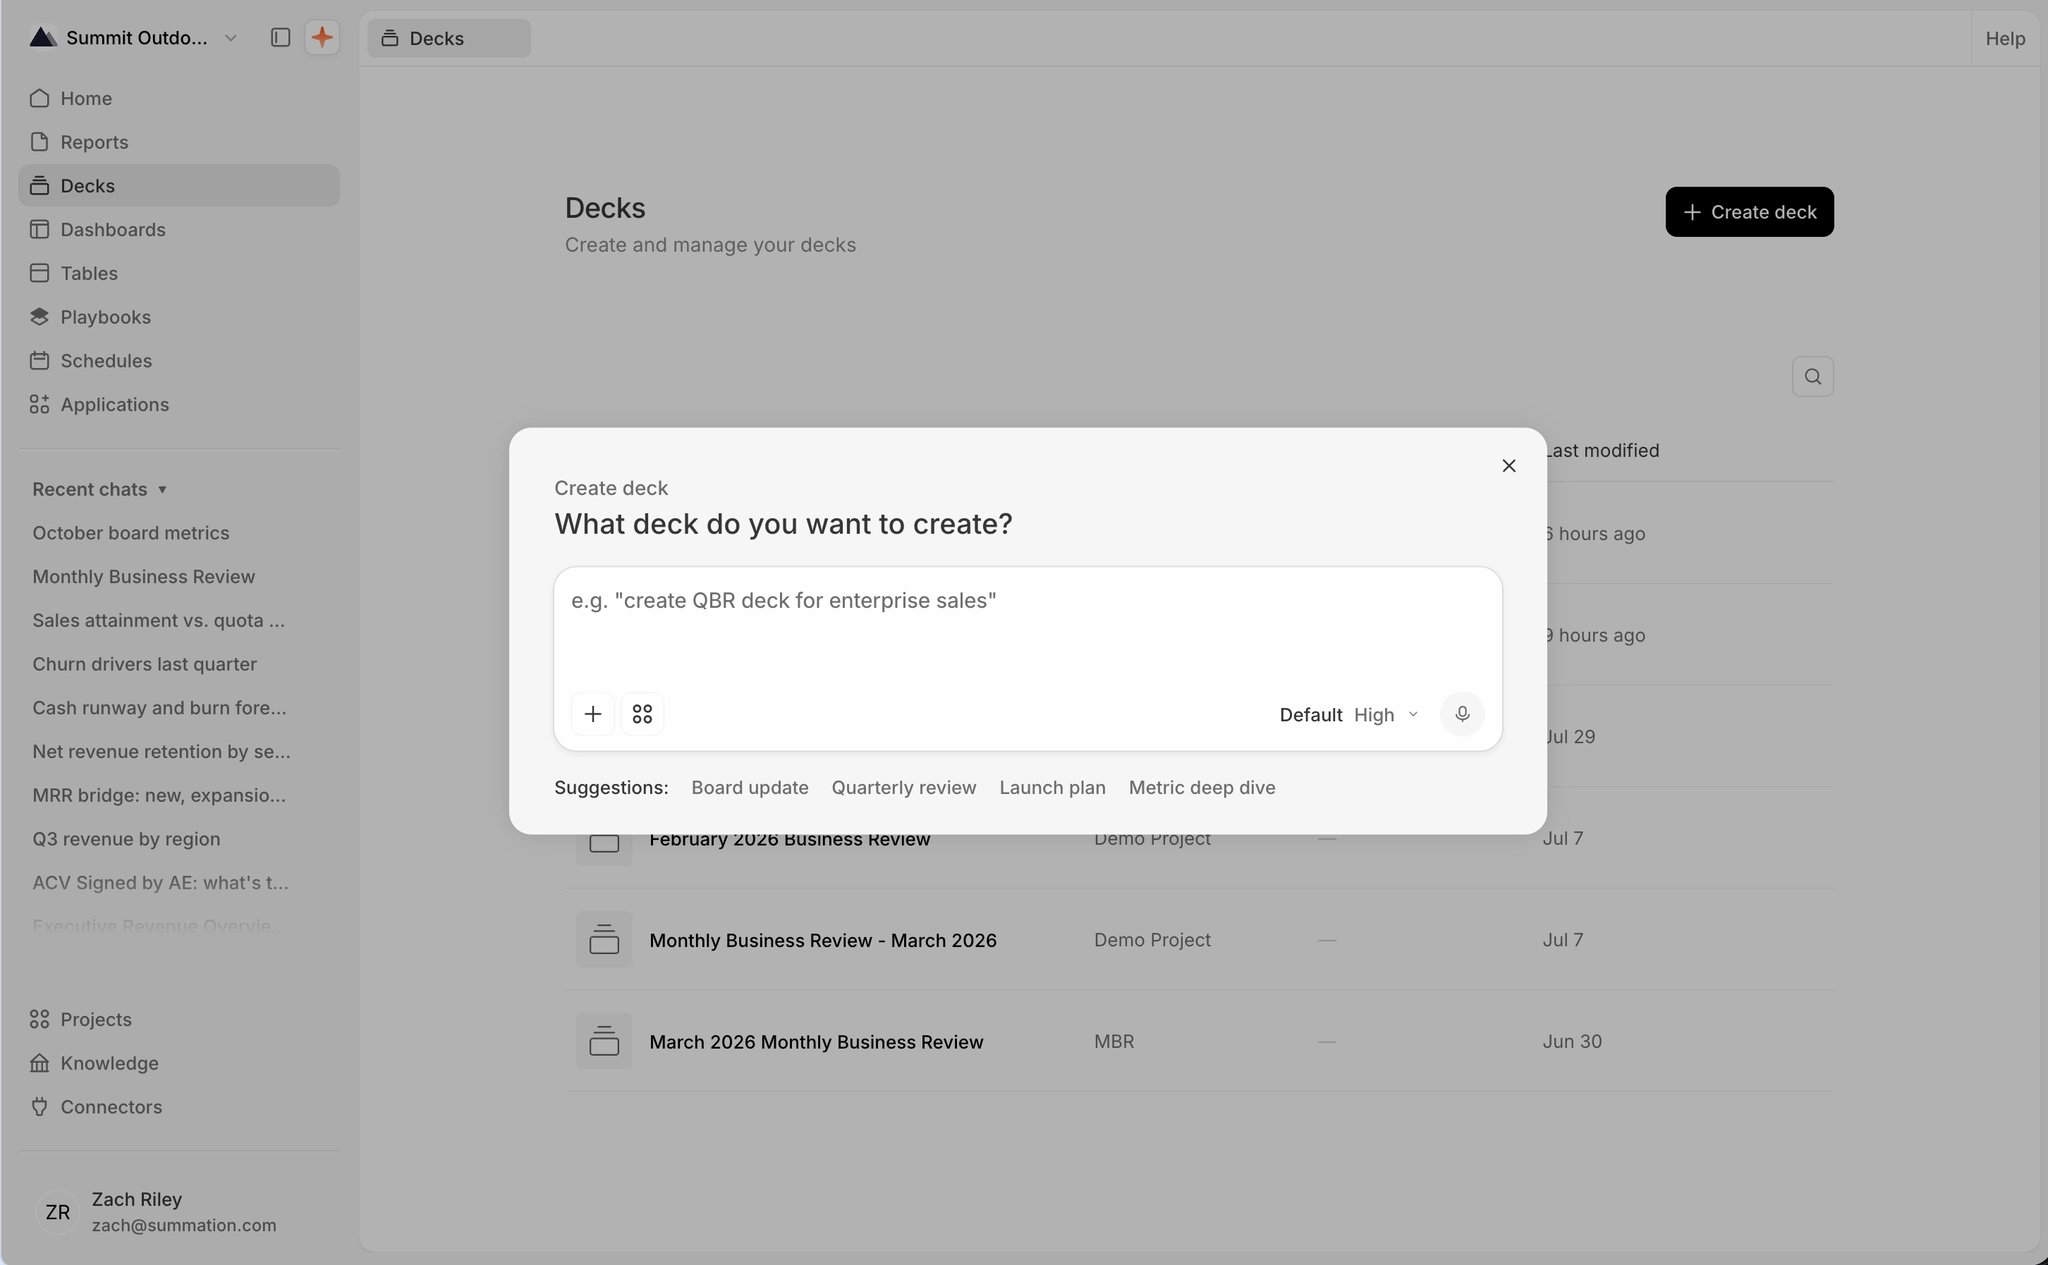
The 'Create deck' dialog: 'What deck do you want to create?' with the placeholder 'e.g. \"create QBR deck for enterprise sales\"' and suggestion chips Board update, Quarterly review, Launch plan, and Metric deep dive. Behind it, the Decks page lists rows including 'February 2026 Business Review', 'Monthly Business Review - March 2026', and 'March 2026 Monthly Business Review'.

Describe the deck you want

Two more ways: from a project’s Create → Deck (see Create artifacts from project), or by asking Addison in a chat (see Creating artifacts). Branding. Addison builds against a Summation template by default, or against your own branded template. You can also attach an existing PowerPoint or PDF and ask Addison to match its look. It keeps the source’s layouts, colors, and logo while filling in new data.

Find and open decks

The Decks page lists your decks across all projects, with columns for Name, Project, Created by, and Last modified, plus search. Click one to open it; ⌘-click (Ctrl-click) opens it in a new tab. Decks also appear as .sdeck folders in their project’s file browser.
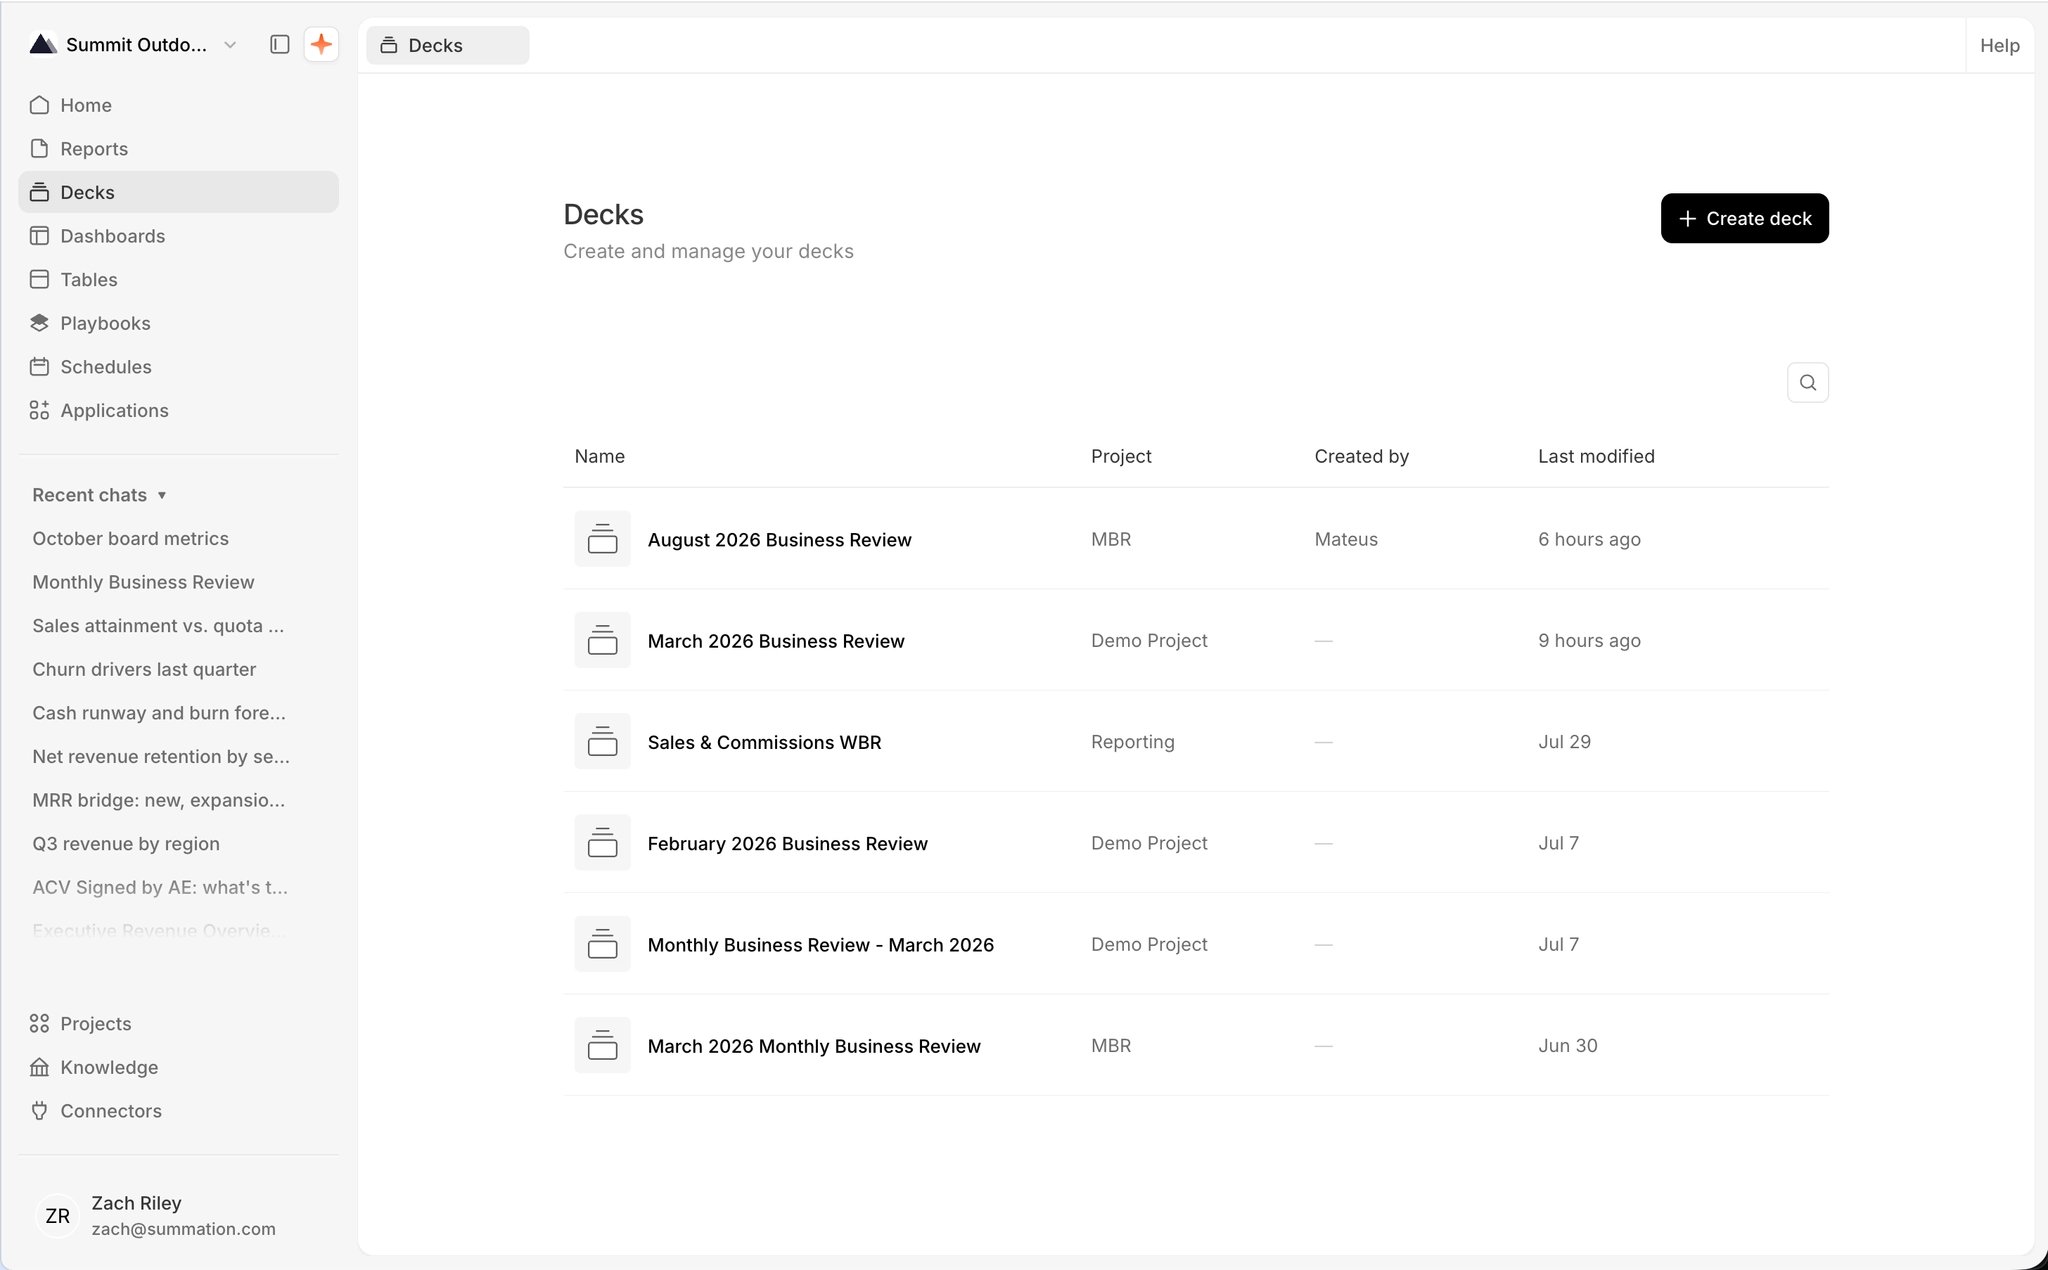
The Decks page at /decks titled 'Decks' with the subtitle 'Create and manage your decks', a Create deck button in the top-right, and a search control. A table lists decks across projects with columns Name, Project, Created by, and Last modified, including 'August 2026 Business Review', 'Sales & Commissions WBR', and 'February 2026 Business Review'.

The Decks page

While a deck is still generating, its row shows progress and flips to Deck ready (or Failed / Cancelled) when the run finishes.

Rename, duplicate, and delete

Each deck row on the Decks page has a trailing ⋯ menu with Rename, Duplicate, and Delete, and right-clicking the row does the same. Inside an open deck, the same actions live in the toolbar ⋯ menu: Rename edits the title in place, and Duplicate opens the copy. Duplicate is available once the deck is ready. Deleting can’t be undone.
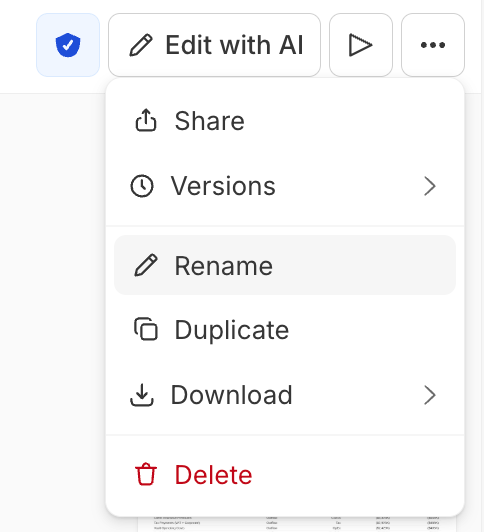
The ⋯ menu open in a deck's toolbar, beside the verification badge, Edit with AI, and the presentation-mode play button. The menu lists Share, Versions (with a submenu arrow), Rename (highlighted), Duplicate, Download (with a submenu arrow), and Delete in red.

A deck's ⋯ menu in the toolbar

Verify a deck

Click the verification badge (shield) in the toolbar to open the Verification Hub, then refresh verification to run it. See Verification for how the Hub works and what each status means. Decks also carry visual checks: element containment, overlapping elements, chart and table legibility, font consistency, theme fidelity, slide order, cover and pagination, and empty slides. These run only when the deck can be rendered for inspection and skip cleanly otherwise, so they won’t always appear in the Hub. Verification is available once a deck is ready.
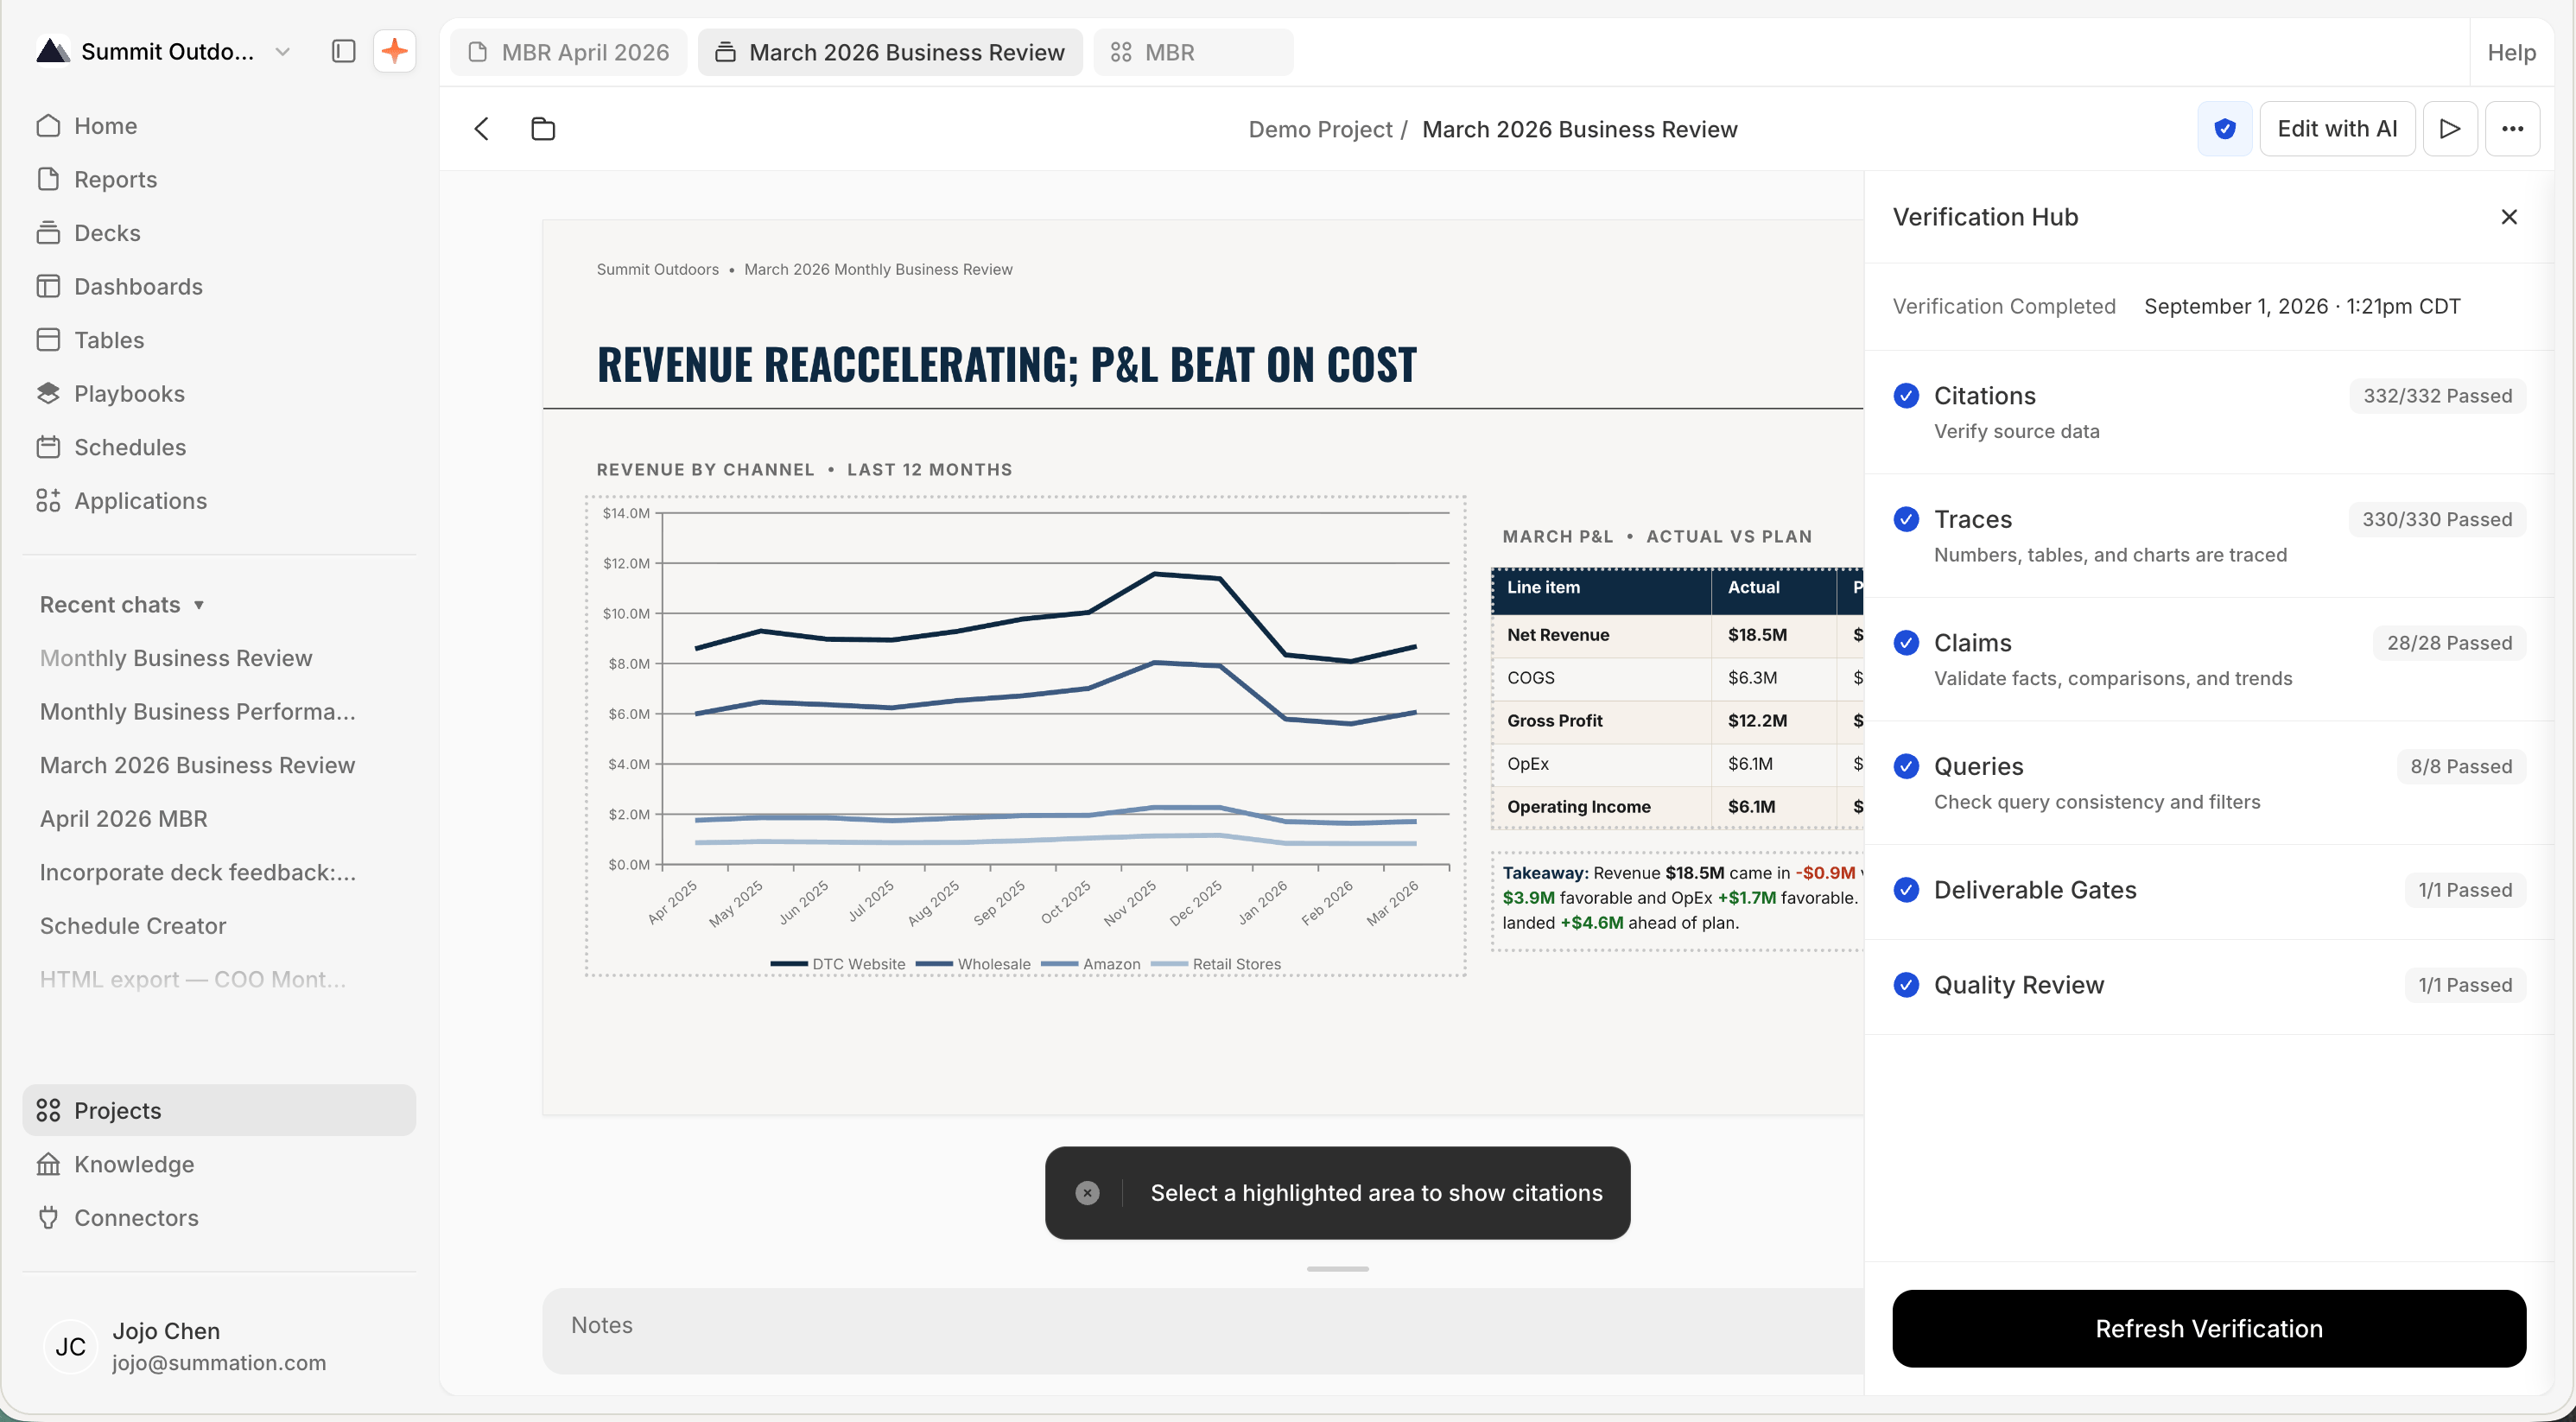
The Verification Hub panel for the 'March 2026 Business Review' deck, showing 'Verification Completed September 1, 2026, 1:21pm CDT' and six dimensions, each marked with a blue check and a pass count: Citations 332/332, Traces 330/330, Claims 28/28, Queries 8/8, Deliverable Gates 1/1, and Quality Review 1/1. A Refresh Verification button sits at the bottom.

The Verification Hub for a deck

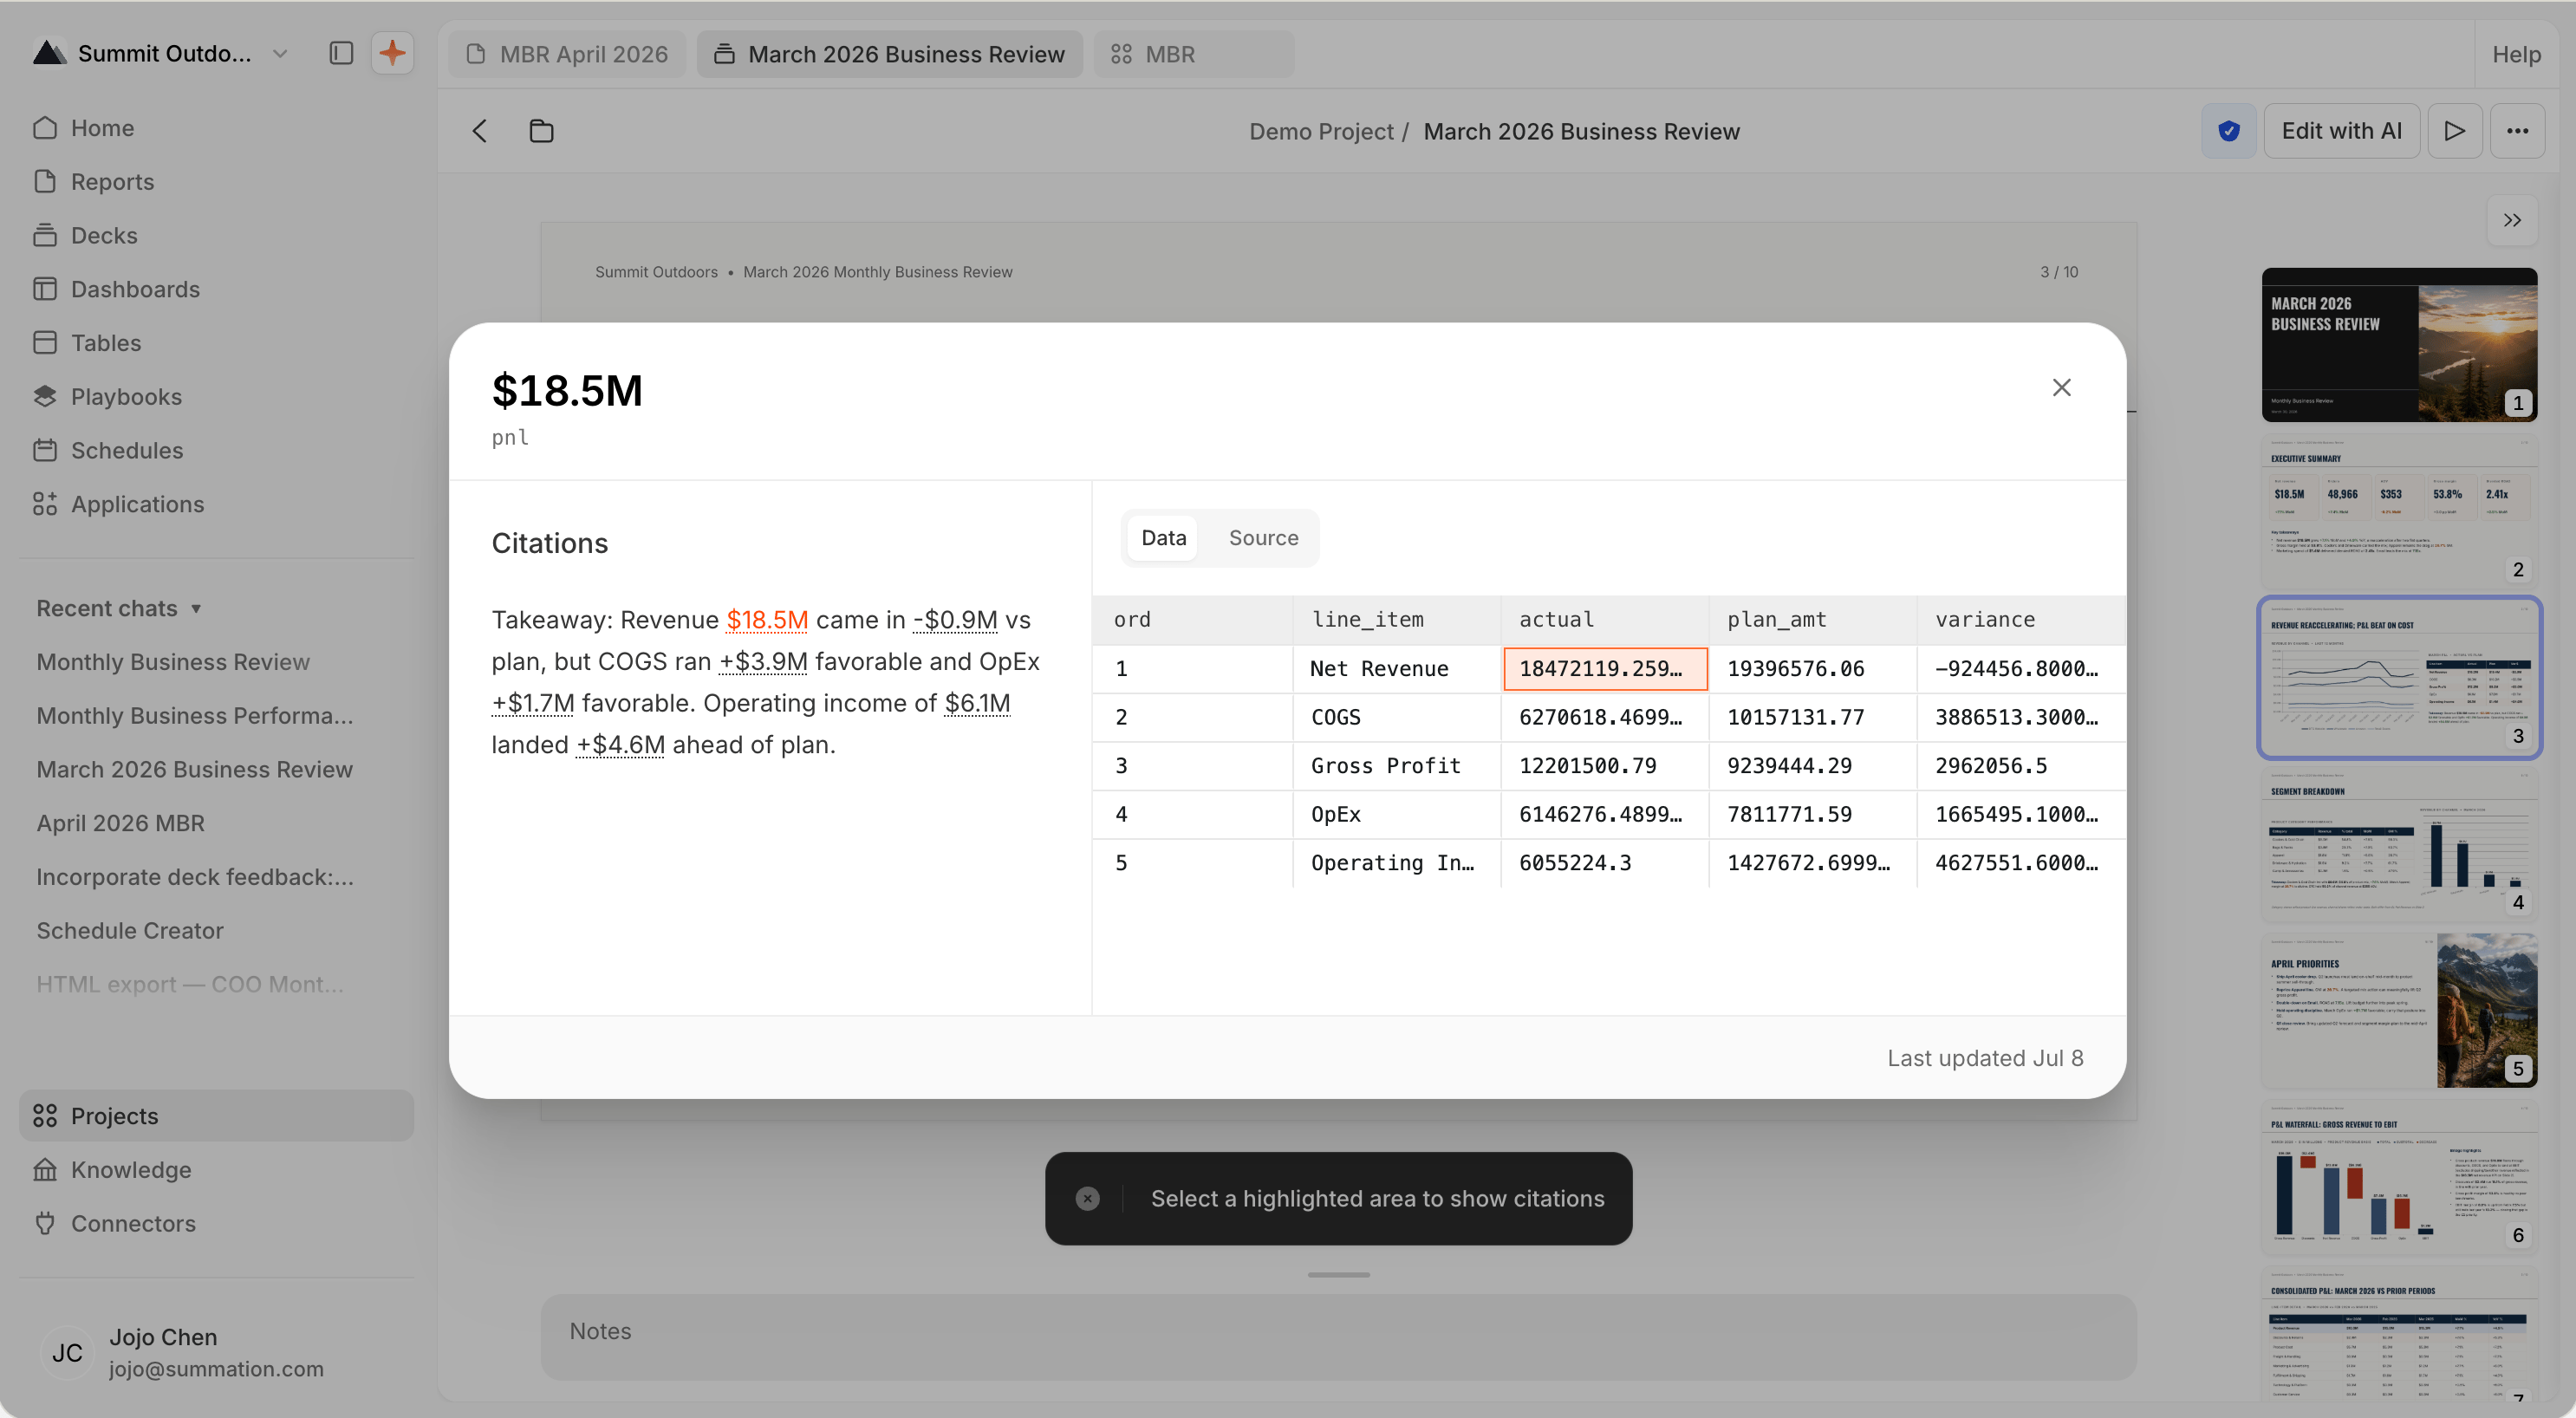
Citations in action. Every figure Addison cites on a slide is recorded against its source. Click the N Citations button below the slide to give citation-carrying regions a dotted highlight, then click one to open a Value trace showing the source data behind it.
A slide titled 'Revenue Reaccelerating; P&L Beat on Cost' in citations mode: a line chart of revenue by channel is outlined with a dotted orange highlight, and a 'Value trace' dialog for $18.5M ('pnl') shows a Citations panel with the takeaway text on the left and Data/Source tabs on the right, a table with columns ord, line_item, actual, plan_amt, and variance for Net Revenue, COGS, Gross Profit, OpEx, and Operating Income. The dialog footer reads 'Last updated Jul 8', and a bar behind it reads 'Select a highlighted area to show citations'.

Value trace: click a highlighted region to see its source

Ask and edit with Addison

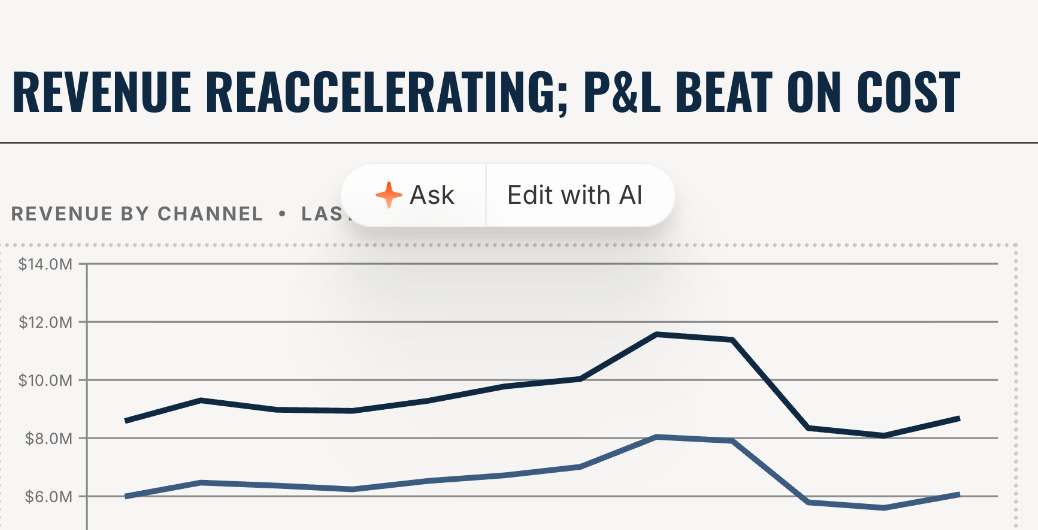
Slides are not typed into directly. Instead, click any region of a slide (a text block, chart, table, or image) to get a floating toolbar with two actions:
  • Ask: ask Addison a question about that region. The answer streams in the chat pane.
  • Edit with AI: describe a change to that region.
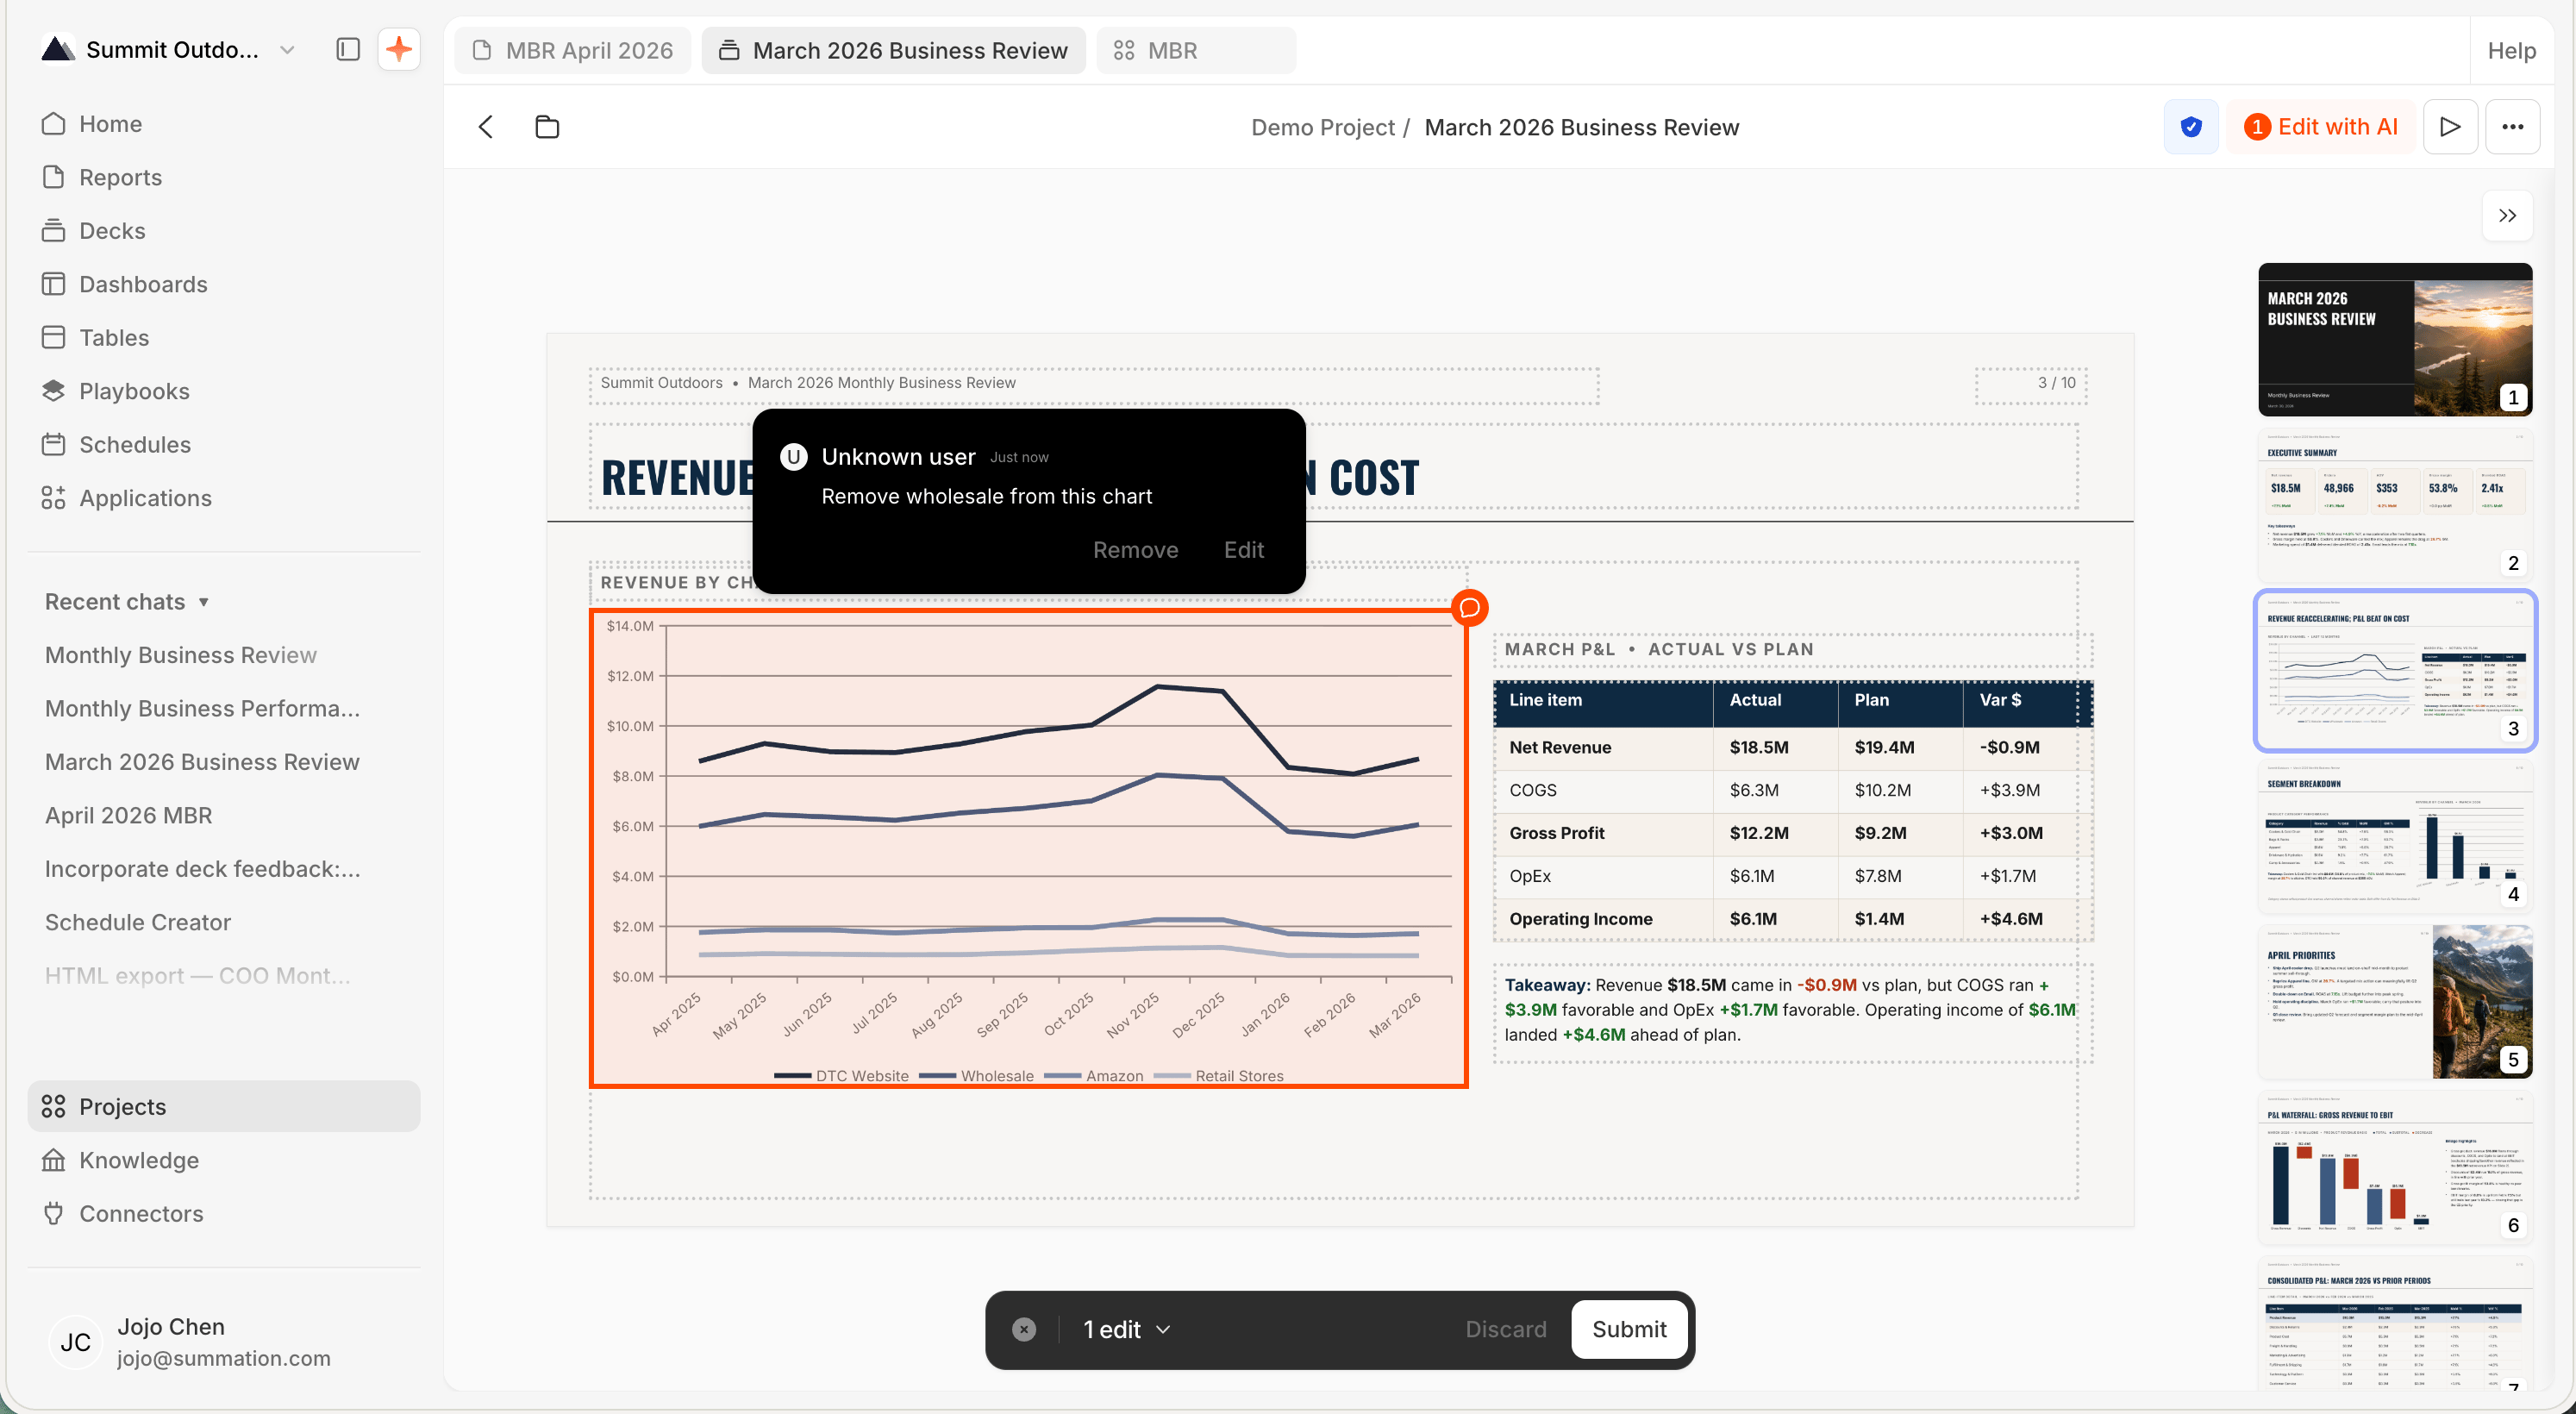
Toggle Edit with AI in the toolbar to edit anywhere in the deck. Every region you describe a change for is queued as a pending edit, marked on the slide, and a bar below the deck tracks the count. Review the queue, remove any edit you don’t want, then apply them. Addison regenerates the affected slides and streams progress in the chat pane. You can stop a run in progress, or discard the whole queue.
A floating toolbar above a highlighted chart on the slide 'Revenue Reaccelerating; P&L Beat on Cost', offering two actions: 'Ask' (with a sparkle icon) and 'Edit with AI'.

Click a region to Ask or Edit with AI
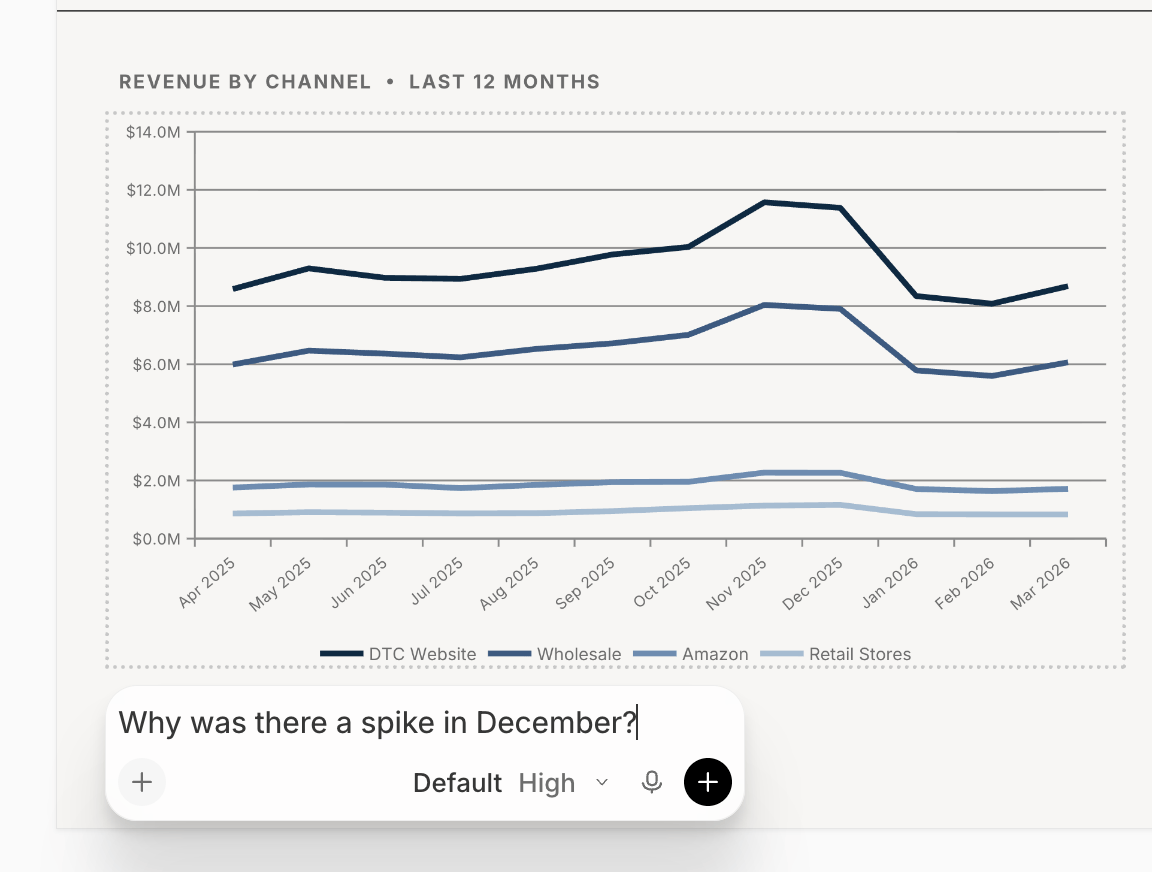
A prompt box below a 'Revenue by Channel' line chart, reading 'Why was there a spike in December?', with a + button, a Default/High model selector, and a send button.

Ask: question the selected region

A deck in Edit with AI mode on the slide 'Revenue Reaccelerating; P&L Beat on Cost': the revenue chart is highlighted in orange with a comment marker, and a dark comment popover (attributed to 'Unknown user', just now) reads 'Remove wholesale from this chart' with Remove and Edit actions. The top-right toolbar shows a '1 Edit with AI' badge, and a bar at the bottom has a '1 edit' selector with Discard and Submit buttons.

Edit with AI: describe the change

Slides and speaker notes

The slide rail on the right lists every slide as a thumbnail. Click one to open it, or use the arrow keys; Home and End jump to the first or last slide. Collapse the rail with the chevron at its top to give the slide more room. Delete a slide by right-clicking its thumbnail → Delete slide. This can’t be undone, and the last remaining slide can’t be deleted. Adding and reordering slides is done by asking Addison in chat. Speaker notes live in the dock below the slide, one set per slide. Type directly into it (notes autosave) and drag the dock’s top edge to make it taller.
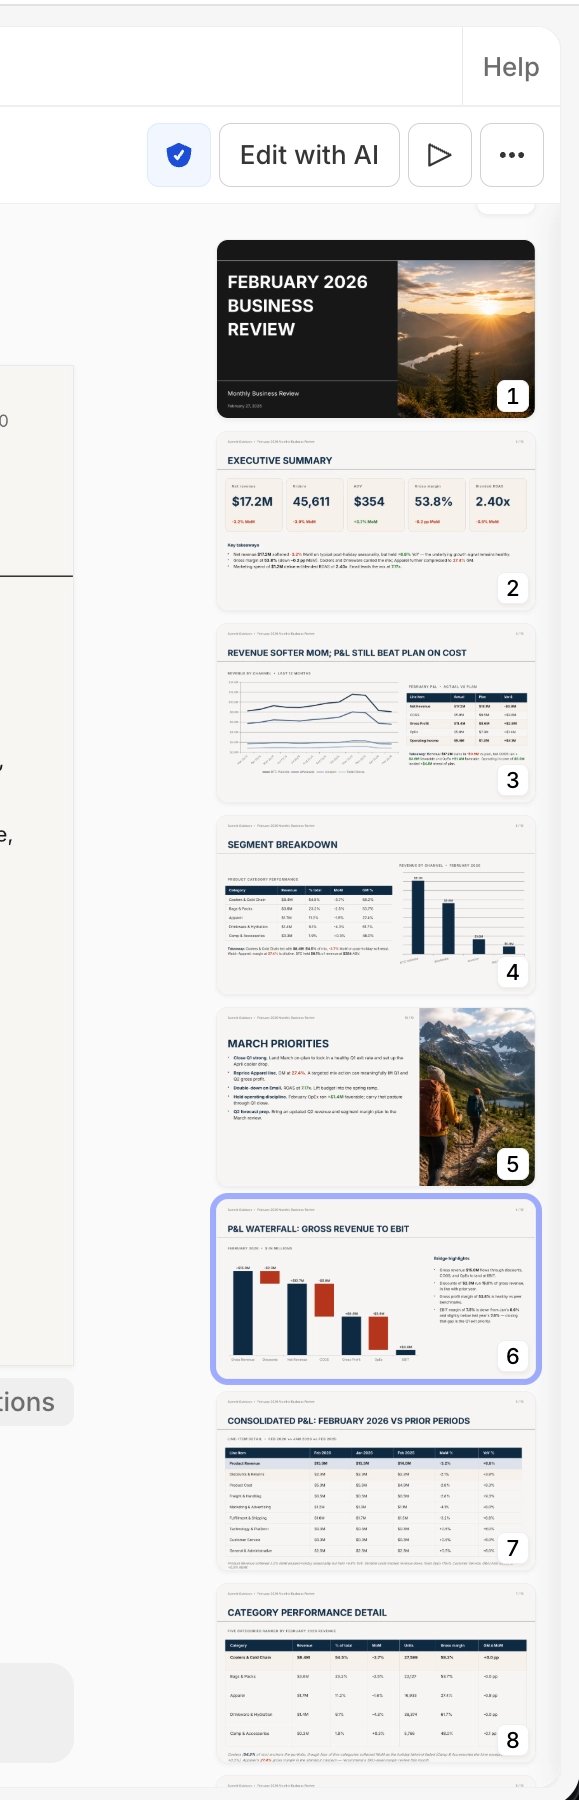
The deck's right-hand slide rail showing numbered thumbnails, including an executive summary slide, a trend chart slide, a segment-breakdown slide, a photo slide, and a 'P&L Waterfall: Gross Revenue to EBIT' slide, selected and outlined in blue.

The slide rail

Present

Click Presentation mode (the play icon) in the toolbar to present fullscreen: one slide at a time on a black backdrop, with no toolbars or overlays. A Slide N of M indicator sits at the bottom. Presentation mode is available once the deck is ready.
The deck toolbar with the verification badge, Edit with AI, and a play-triangle button hovered, showing a 'Presentation mode' tooltip, followed by the ⋯ menu button.

Presentation mode in the toolbar

Version history

Every regeneration is saved as a version. Open Version History from the toolbar ⋯ menu to see the timeline and open an earlier version. While you’re viewing a pinned earlier version, a banner marks it as history, and the actions that would change the live deck (Edit with AI, Rename, Duplicate, Share, Delete) are disabled until you return to the latest. Some workspaces see a Versions submenu in the ⋯ menu instead. It holds the same history as a simple list of versions with their timestamps, without the side panel.
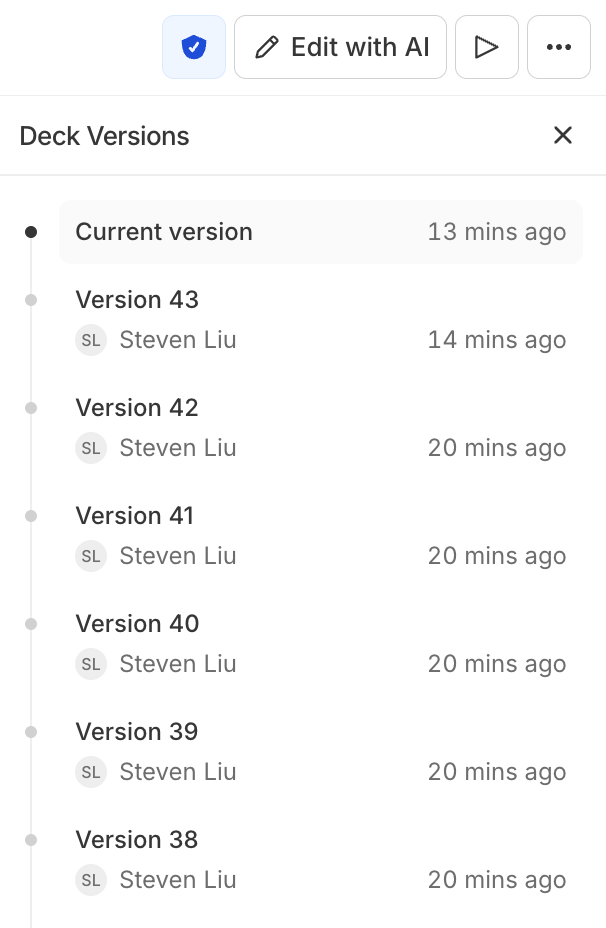
The 'Deck Versions' panel listing the Current version and Version 43 down to Version 38, each with an author initials avatar and a relative timestamp (13 to 20 mins ago), connected by a vertical timeline with the current version marked by a filled dot. The deck toolbar above shows the verification badge, Edit with AI, the presentation-mode play button, and a ⋯ menu.

Deck Versions timeline

Share and publish

Open a deck’s ⋯ menu → Share, then Publish to create a view-only link for your organization. Viewers sign in or create an account to open it. The read-only viewer shows the slides, the slide rail, and citations, with editing turned off. Unpublish at any time.
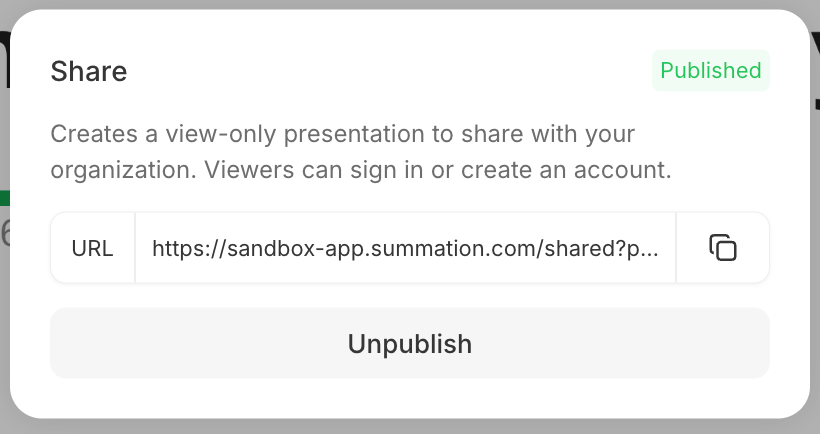
The deck Share dialog labeled 'Published'. It explains it 'Creates a view-only presentation to share with your organization. Viewers can sign in or create an account.', shows a URL field containing a truncated /shared presentation link with a copy button, and an Unpublish button.

A published view-only link

Download

Open a deck’s ⋯ menu → Download and choose a format. Downloads are also available from each row’s ⋯ menu on the Decks page.
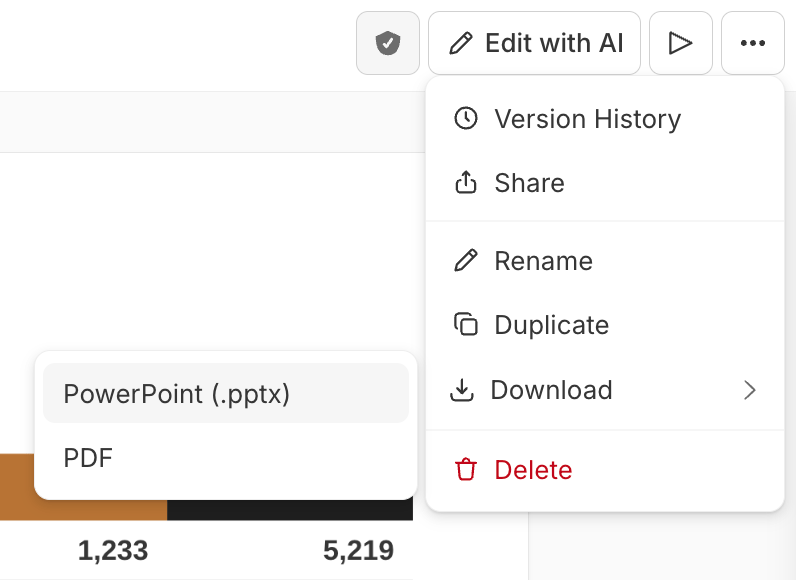
A deck's ⋯ menu open with Version History, Share, Rename, Duplicate, and Download (which expands to a submenu showing PowerPoint (.pptx), highlighted, and PDF), plus Delete in red; the toolbar above shows the verification badge, Edit with AI, the presentation-mode play button, and the ⋯ button.

Download → PowerPoint or PDF