A view is a saved pivot or perspective over a single table — a stored arrangement of grouping, aggregations, filters, sorting, and calculated fields. It reads live from the table (nothing is materialized), and it’s a first-class object: views appear on the Tables page with Type = View, and dashboard cards are built on the same view shape.

What you can do

Build a view from the Pivoting panel — the pivot icon in the table toolbar. Its sections are Row, Column, Values, and Filter:
  • Row — group by one or more columns down the left. Ordering lives inside each Row field (its Order: and Sort by: controls), as do its Show total and Show grand total checkboxes.
  • Column — pivot columns across the top, with the same per-field total checkboxes.
  • Values — the measures to aggregate (sum, count, average, min, max, median, distinct count), plus calculated expressions.
  • Filter — restrict which rows the view includes.
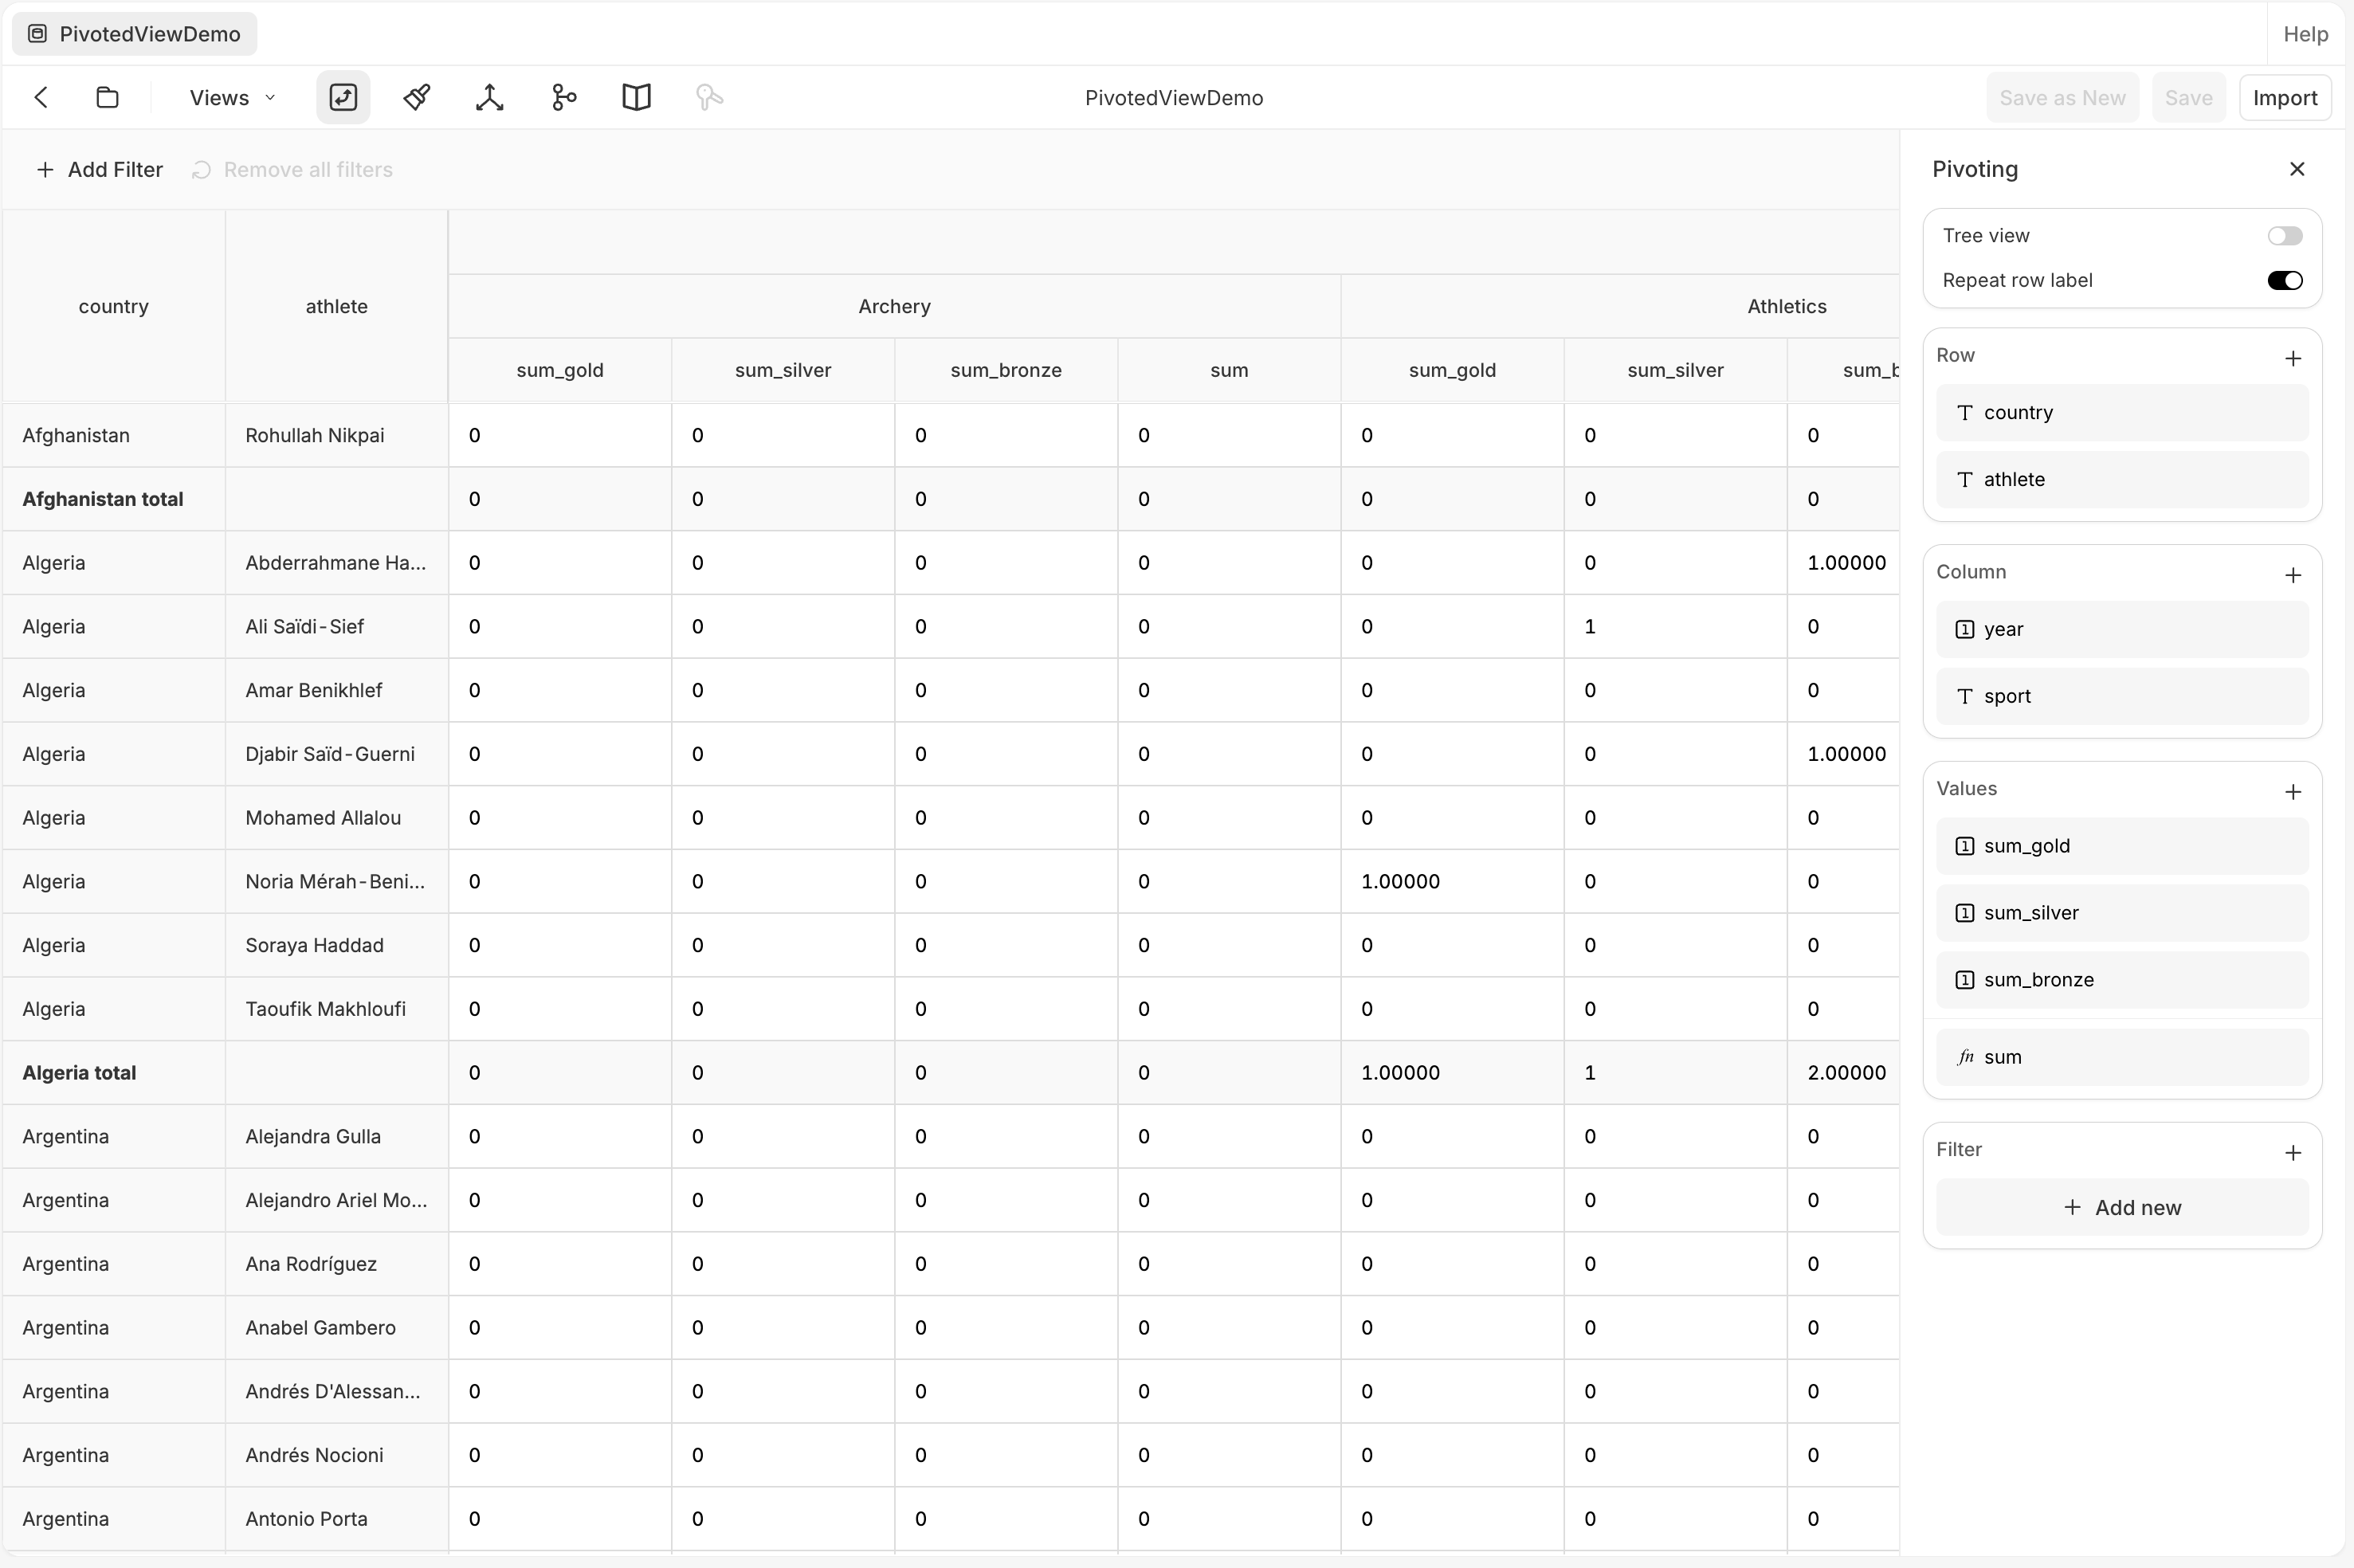
Below these, an untitled card holds just Tree view and Repeat row label.
A pivoted view 'PivotedViewDemo': rows grouped by country and athlete, columns pivoted by sport (Archery, Athletics) each with sum_gold, sum_silver, sum_bronze, and sum values, and per-country total rows. The Pivoting panel on the right has Tree view and Repeat row label toggles, and Row (country, athlete), Column (year, sport), Values (sum_gold, sum_silver, sum_bronze, sum), and Filter sections. Save as New, Save, and Import are top-right.

A pivoted view and its Pivoting panel

A view is a lightweight, live slice of one table. When you need a new persisted or joinable dataset, create a calculation table instead.

Formatting

Style a view from the Formatting panel (the paintbrush icon in the toolbar). The button is enabled only when a view is open, so the raw Default table can’t be formatted. By default the panel targets the whole Table (the Selected Cells option is disabled); with the conditional_formatting flag on, the target segments become All, Headers, and Cells. Either way the controls are cell color, text style (bold, underline, italic, strikethrough), alignment, wrapping, borders, a prefix / suffix, a multiplier, and number display.
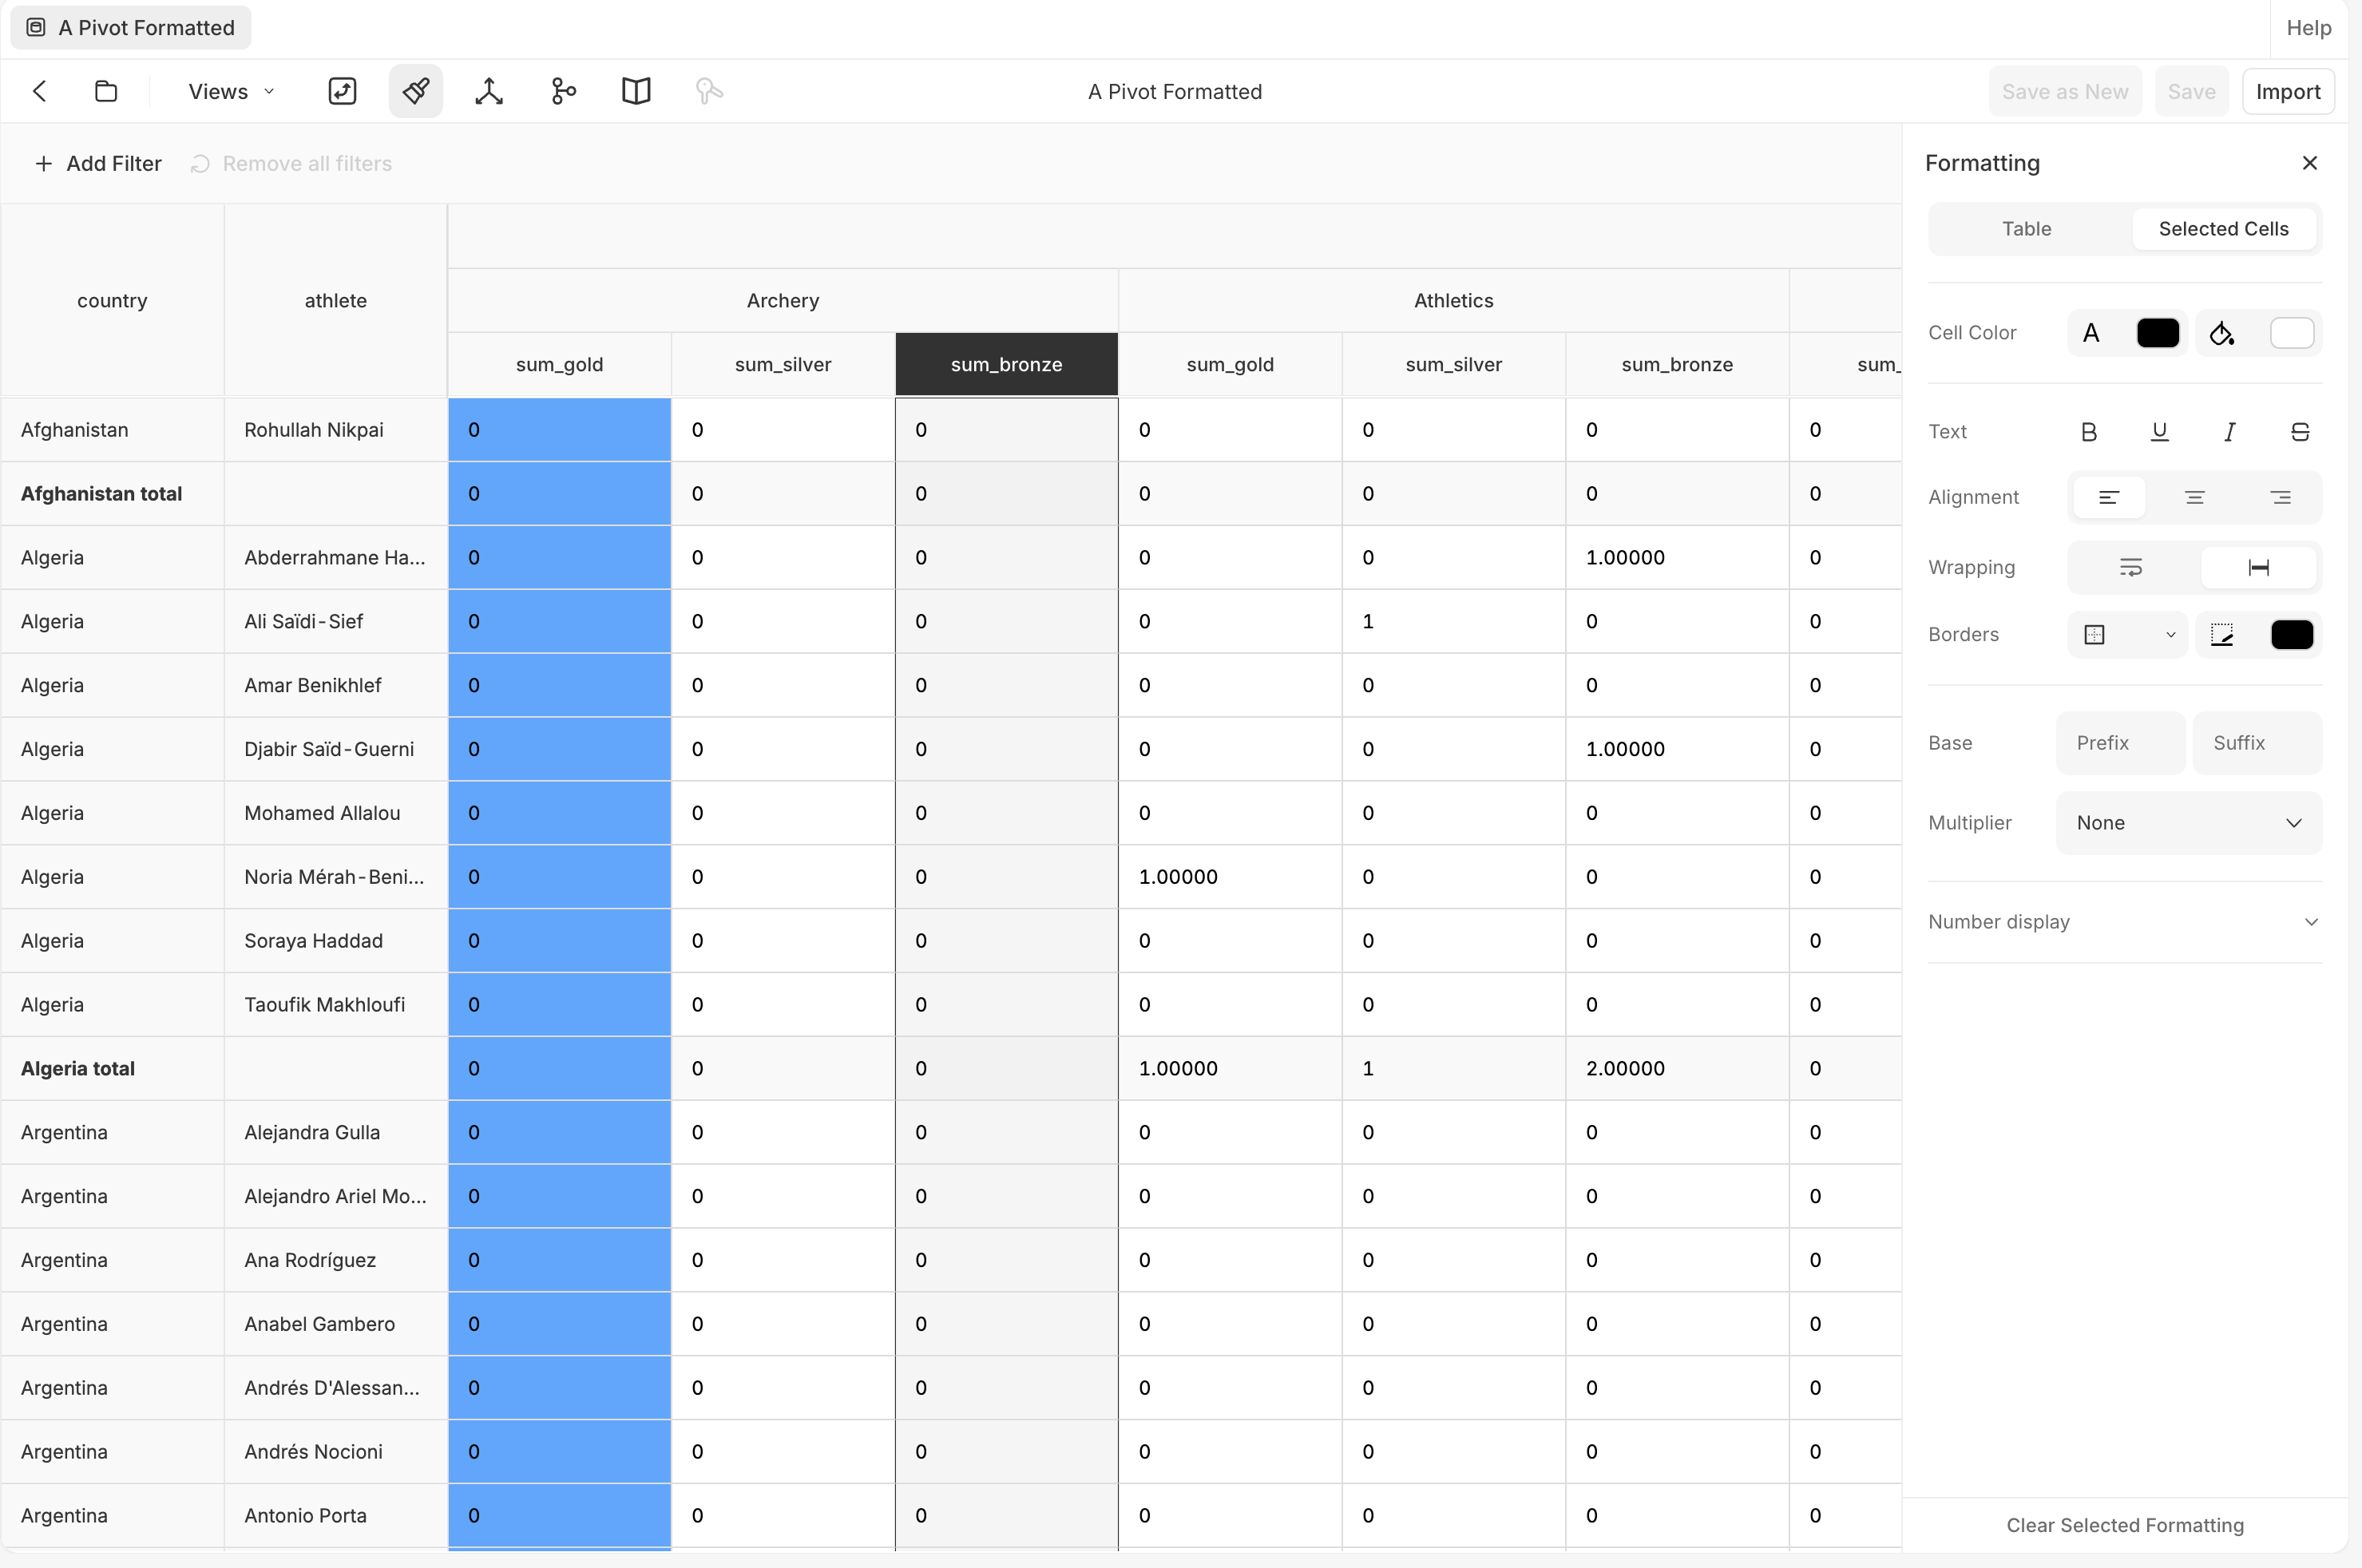
A formatted pivot view 'A Pivot Formatted' with the sum_gold column highlighted blue. The Formatting panel on the right has a Table / Selected Cells toggle and controls for Cell Color, Text (bold, underline, italic, strikethrough), Alignment, Wrapping, Borders, Base (Prefix / Suffix), Multiplier, and Number display, plus a 'Clear Selected Formatting' action.

The Formatting panel (Selected Cells)

Create and manage

Open a table and use the Views dropdown in the grid toolbar. Default is the raw table; selecting a saved view opens it. Editing the pivot (in the Pivoting panel) starts a draft (marked “Unsaved changes”), then:
  • Save — update the current view.
  • Save as New — promote the draft to a brand-new view.
  • Reset — discard the draft and return to the parent.

Delete a view from the trash icon on its row in the Views dropdown.
The grid toolbar for the table 'olympics_event' showing a 'Views' dropdown and, to its right, the highlighted Pivoting button (a pivot icon with a 'Pivoting' tooltip).

The table toolbar: the Views dropdown and the Pivoting button

Catalog

Like tables, every view carries a catalog (a description, owner, agent-facing description, and per-column descriptions) that Addison reads. See Catalog for what it holds and where to edit it.
Open the Catalog panel from the book icon in the view’s toolbar, the same as for a table.