
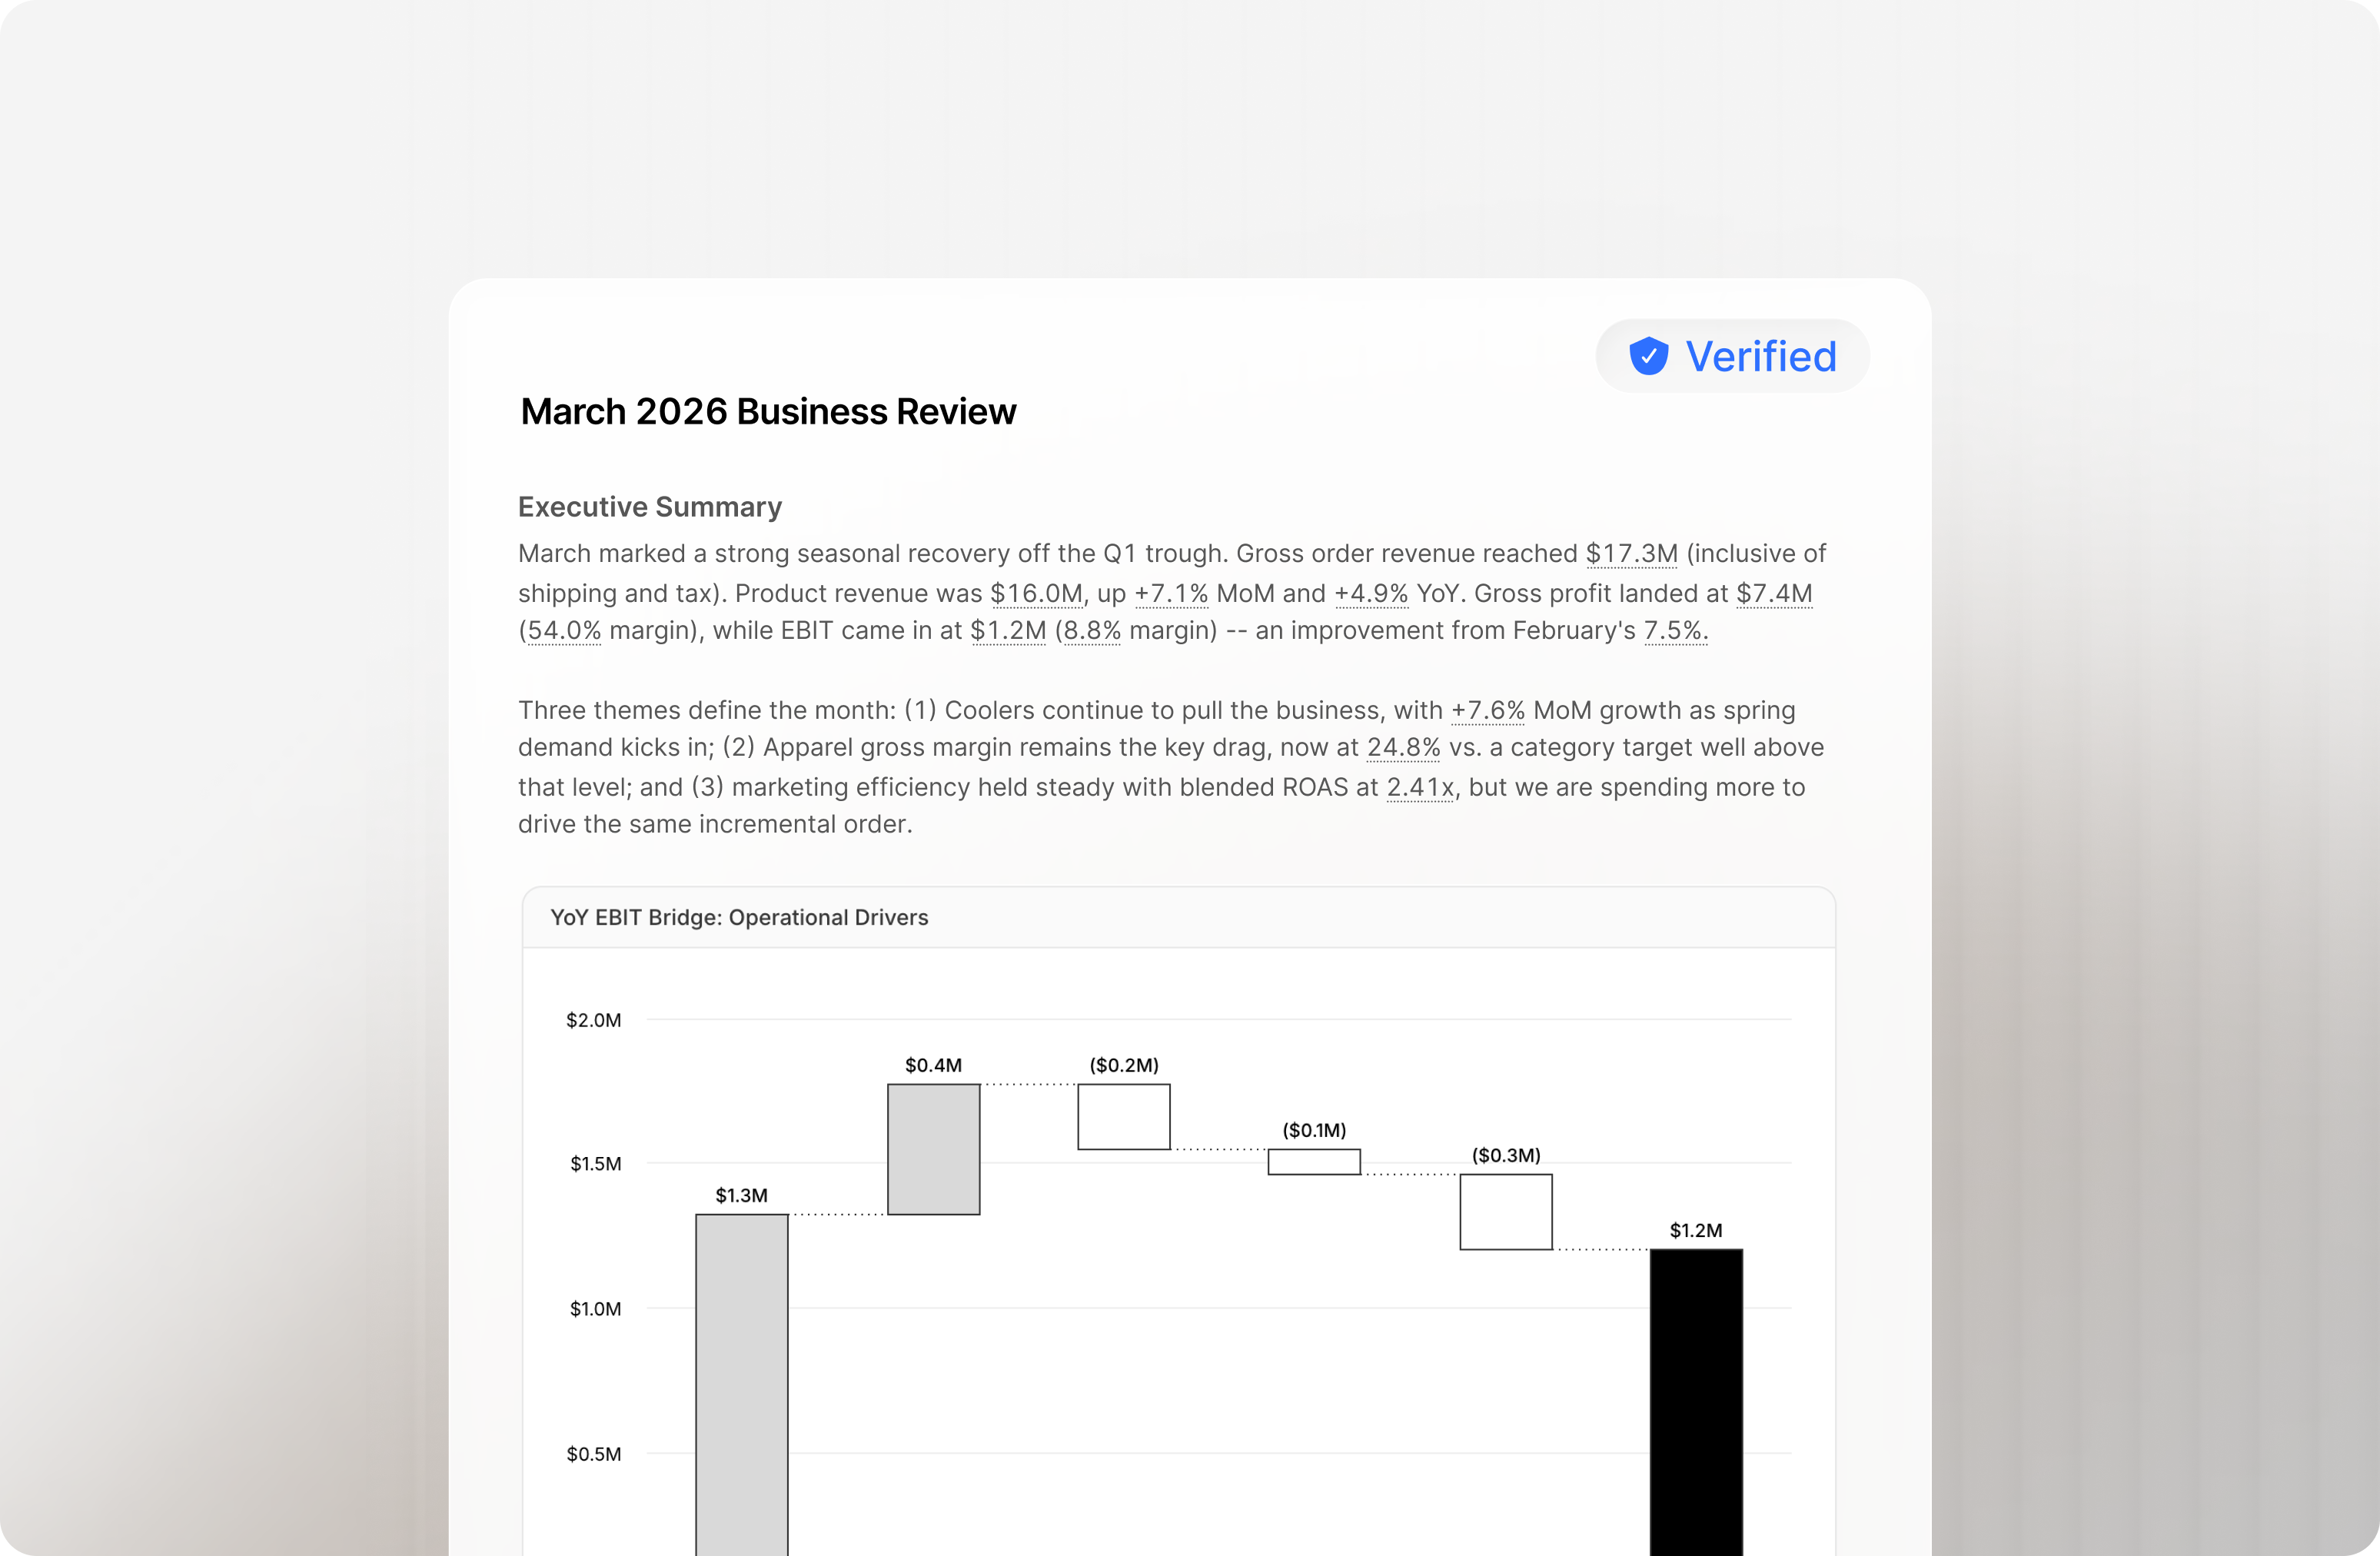
A verified report, with cited figures traced back to their source data
You can also work with the following file types in Summation as well:
Once a workbook or page needs a wider audience, ask Addison to rebuild it as a dashboard, deck, or report. It gains full per-figure citations and a dedicated home in the app.
You can also upload other files (CSVs, PDFs, PowerPoint, Word docs, and more) into a project and have Addison work with them. They’re just ordinary files rather than artifacts, so they aren’t generated or verified the way the above are.
Playbooks (
.spb) sit alongside artifacts. A playbook isn’t an artifact itself: it’s the reusable blueprint that produces them, on demand or on a schedule, so a recurring analysis comes out the same shape every time with fresh data. One playbook can produce several artifacts in a single run.
Creating artifacts
There are four ways to create an artifact:- In a chat with Addison: describe what you want and Addison generates it.
- From its dedicated page: Reports, Dashboards, and Decks each have a create button.
- From a project: use Create in the project’s file list (see Create artifacts from project).
- By running a playbook: each run produces that playbook’s declared outputs.
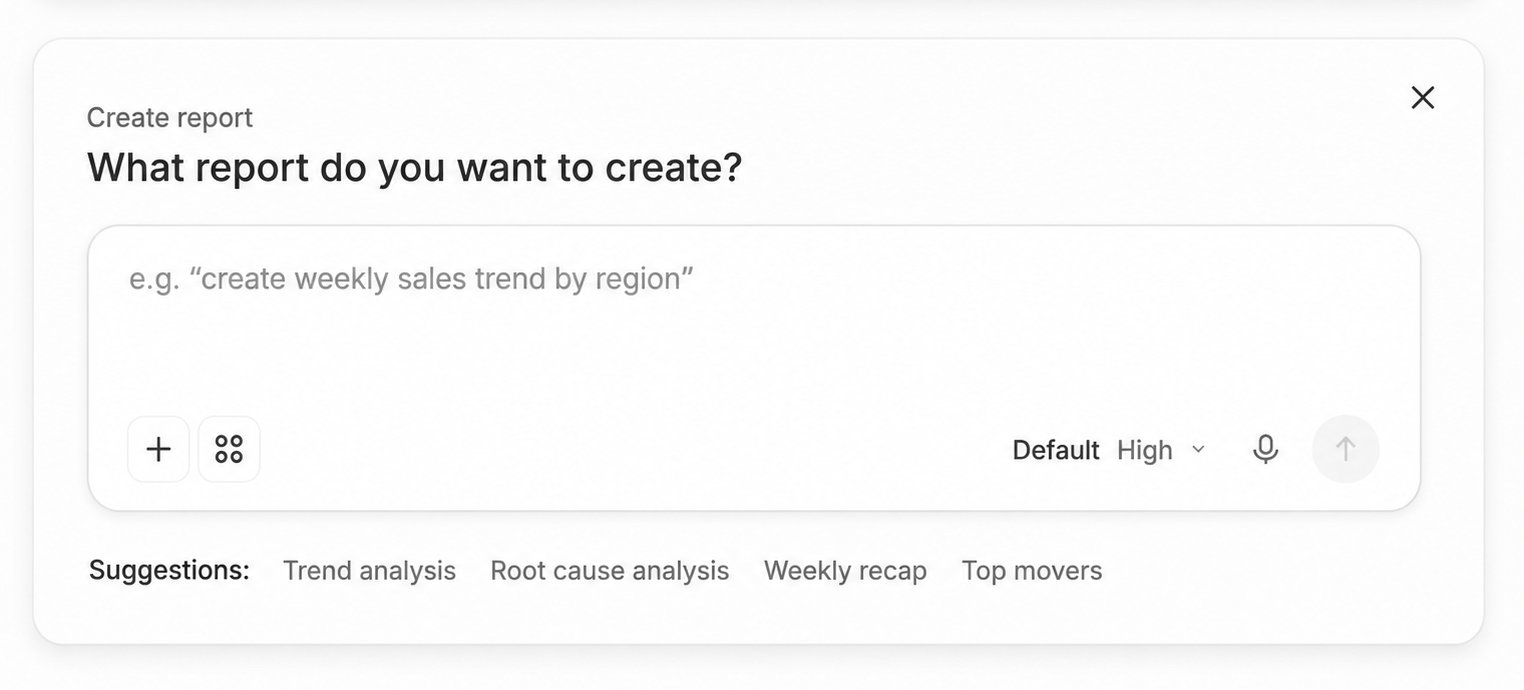
Creating a report
Reports
Written analyses backed by data citations.
Dashboards
Charts and KPIs built from your data.
Decks
Slide-style presentations of your content.
Playbooks
Reusable analyses that produce artifacts on demand or on a schedule.
Excel
Exec-grade
.xlsx workbooks with live formulas.HTML
Standalone, styled
.html reports and pages.