
When to use it
Every finance team has the workbook. It started clean. Three reforecasts later it has a tab nobody opens, hard-coded numbers where formulas used to be, and one person who knows which cells are safe to touch. Rebuilding it from scratch each close is the right answer, and nobody has the time. A forecast model should separate two things: what the data says, and what you’ve decided to assume on top of it. The first half should recompute from source every close. The second half should be the only thing you have to carry forward. That’s the spec. Summation builds it that way and reruns it for you.Understanding the demo
When you delegate your forecast to Summation, you get a workbook where every input sits in one place and everything else computes. Drivers are derived from your actuals and shown with their derivation. Beside each one is an override cell, defaulting to zero, which is the only kind of cell you’re meant to change. Closed months read your actuals and open months read the drivers, so the model reproduces the past before it forecasts the future. A version tab compares the result against plan and every reforecast you hold.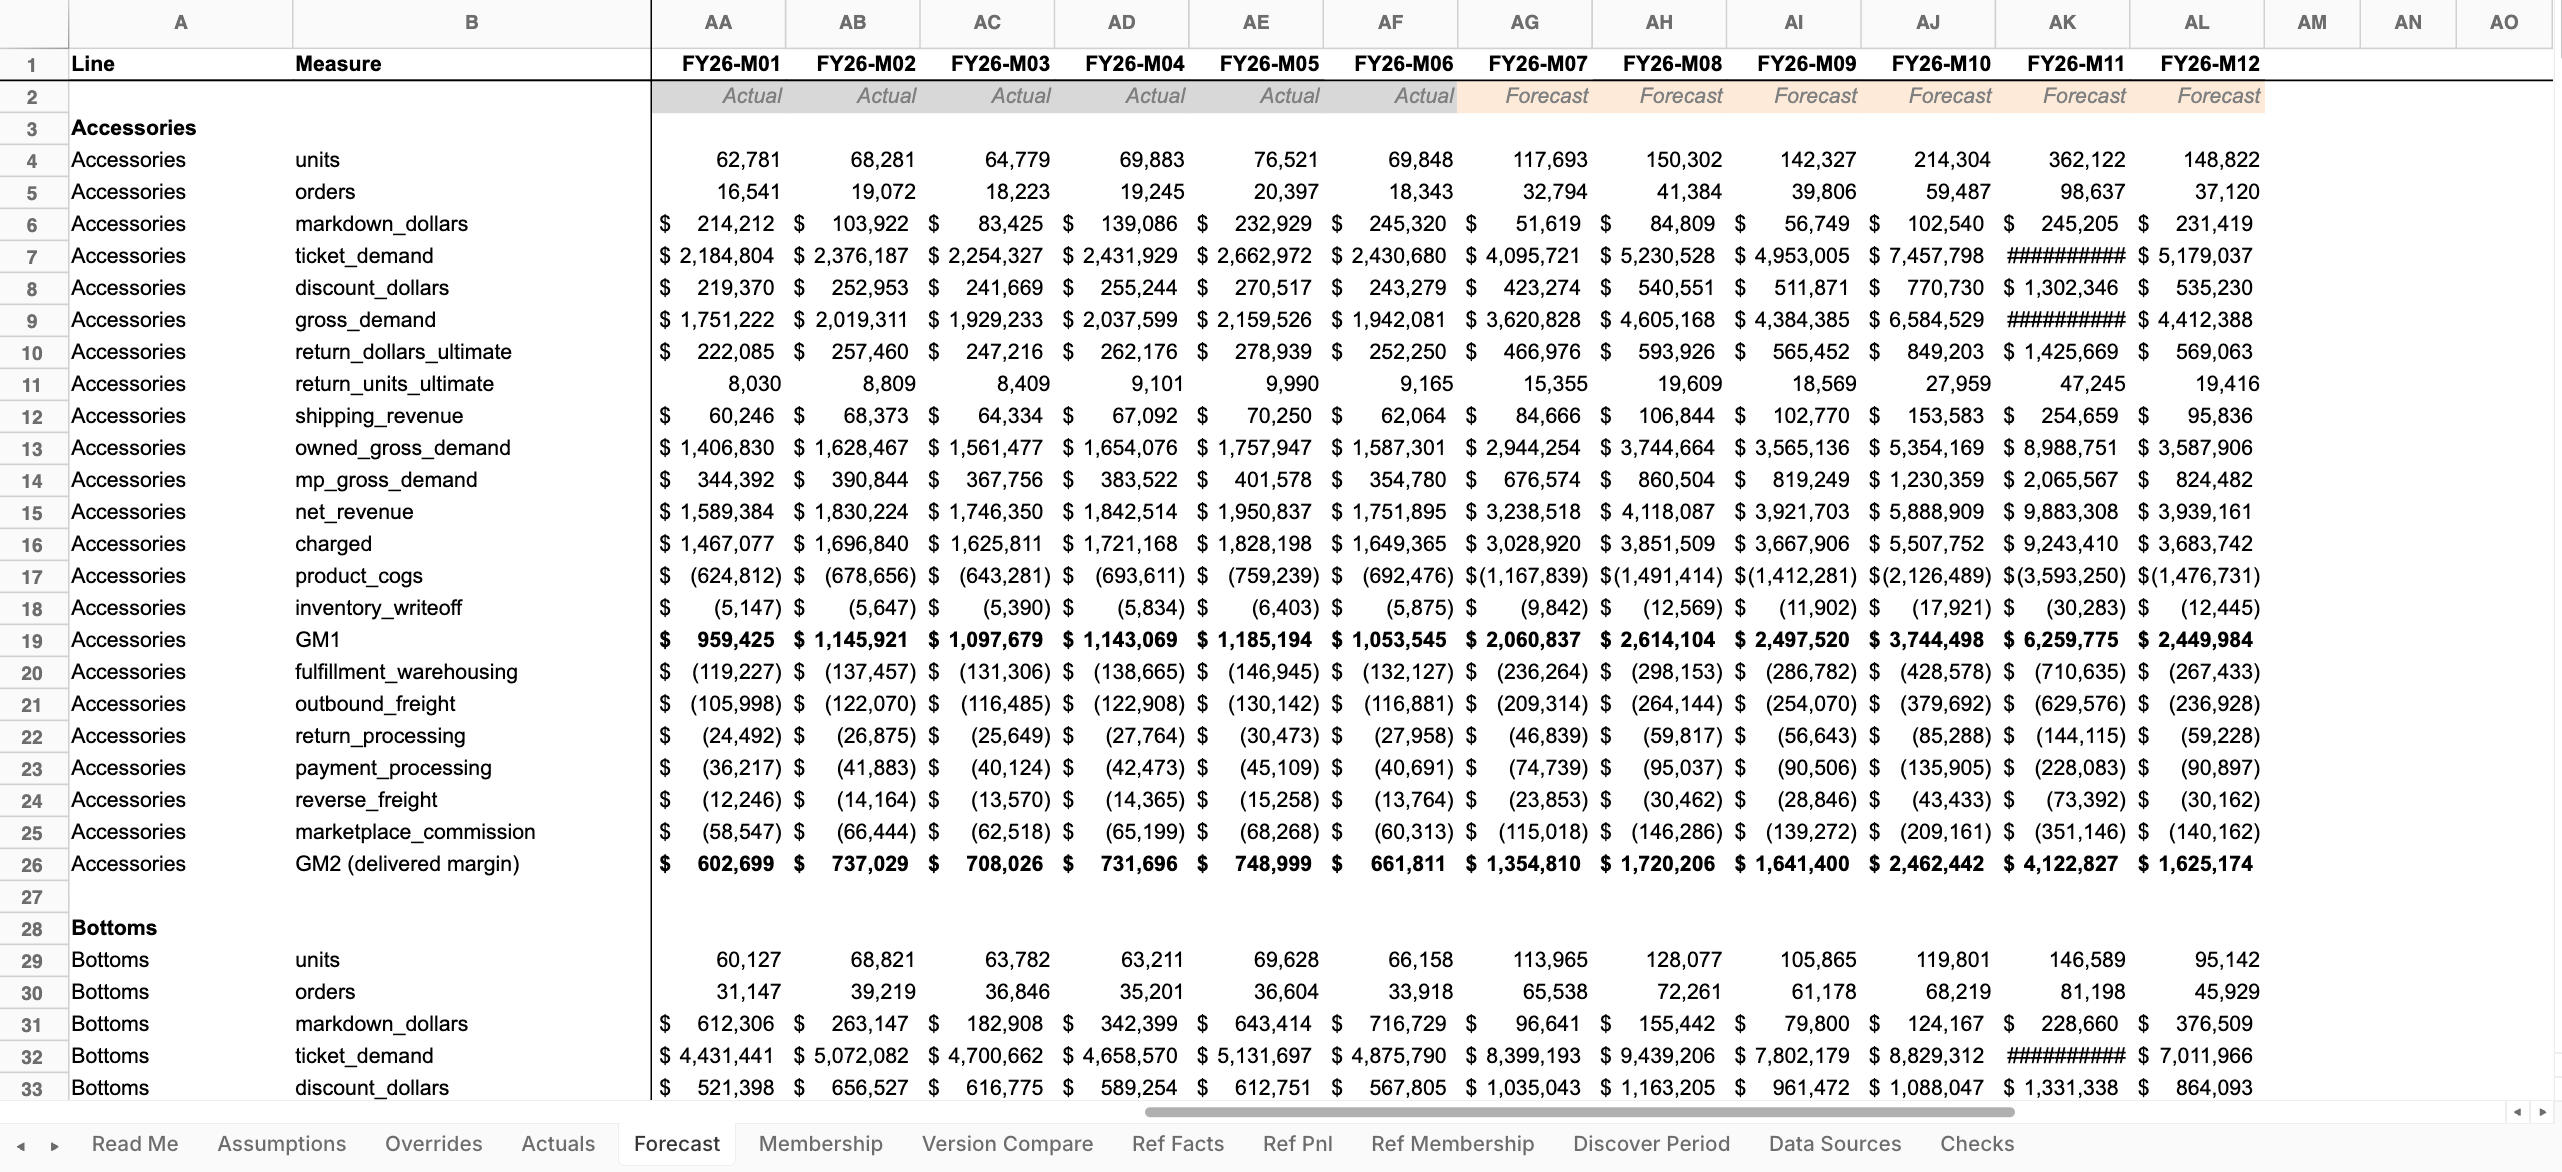
The Forecast tab, with closed and open months side by side
- Read Me: What the model does, where its data comes from, how to refresh it, and what it cannot do
- Assumptions: Every driver with its derivation shown beside it
- Overrides: A zero-default override cell for each driver. Blue cells are the ones you may change; there are no others
- Actuals: The closed months as read from your data, which the model has to reproduce before it forecasts anything
- Forecast: One formula per row across the whole horizon. The Actual/Forecast label above each column is itself a formula, so it moves when the close moves
- Membership: The paid product modelled as a stock rather than a flow: members roll forward, and revenue follows the level
- Version Compare: This forecast against plan and every reforecast, compared at a point in time. The margin gap leads, because on a thin margin it runs several times the revenue gap
- Checks: The model reproduces every closed month from its own arithmetic
- Data Sources: Every extract listed with where it came from
How it works
Addison takes you through a guided setup:- Data: Addison tests your data and tells you what the model can honestly do, including how your revenue breaks down and how much seasonal history you have
- Drivers: It suggests the level of detail, the driver list, and the checks it will use
- Shape: Next comes the horizon, and which numbers are decisions rather than facts
- Build and verify: Summation builds the workbook and checks it against your closed months and plan versions. Its own Checks tab reconciles two independent aggregation paths for every check, and verification runs the workbook’s quality and rubric checks, surfaced as a single pass/fail badge. The workbook is not handed over until both come back clean
- Send: Save it as a Playbook and schedule a Workflow to rerun it each close
What you need
Connect your warehouse to refresh the model each close, or upload an Excel or .csv to build it now.
Make it yours
Edit cells in Summation or in Excel. To change a range, select it and use Edit with AI; remember to refresh verification before sharing. Change an override and watch the forecast move. To save a correction for future runs, ask Addison to add to knowledge. Ask Addison to rebuild the model as a deck or dashboard from the same figures.Try it
In Summation:- Use the setup skill:
/forecast-model - Or follow the guided setup: Get started → Choose a ready-made job → Build a driver-based forecast → Explore demo → Create with my data
Next
Excel workbooks
Live-formula workbooks you can open in Excel.
Verification
How Summation checks accuracy before you share.
Playbooks
Save the instructions so a run repeats exactly.
Workflows
Add a schedule and deliver by email or Slack.