Connect a warehouse or upload a file to give Addison the data it needs to identify insights across your business.
Step 1 of 4. Connect a source or upload a file so Addison has data to work with.If your project already has the files or tables you need, skip ahead to Create your first analysis.
Click Connectors in the left sidebar, then New connection at the top right. The wizard has three steps:
The Connectors page: your data connections and their status
1
Choose a data source
Snowflake, Postgres, and BigQuery sit under Popular; the rest are under Other.
Step 1: choose a data source
2
Enter the details
Give the connection a Name. It’s the identifier used in SQL later, so use letters, numbers, hyphens, and underscores only. Then fill in the credentials and click Test connection before continuing. A pass means Summation could authenticate and reach your data.
Step 2: connection details and credentials
3
Add datasets
Pick the tables to bring in. Each one becomes a dataset available to Addison, to artifacts, and to your tables and data catalog.
Step 3: pick the datasets to bring in
How Summation reads and refreshes data depends on the connector and its settings. See Connectors for details.
Click Projects in the left sidebar (near the bottom, just above your profile) to see the list of projects you have access to. Click the project you want to add the file to — or New Project if you’re starting fresh. This opens the project’s workspace.Above the file list, click + Import, then choose Upload Files from the dropdown. Pick the file from your computer: CSV, Excel, PDF, PowerPoint, and more.The file lands in the project, and that’s already enough to work with: Addison can read it, analyze it, and build artifacts straight from it.It does not become a table on its own. To get it into the data grid, queryable in SQL and with a catalog you can describe, ask Addison to convert it: “turn this CSV into a table.” Worth doing for anything you’ll come back to.
A project's file list, with the Import menu open
You can also drop a file straight into the Addison chat composer with its + button. That’s fine for a one-off question, but it’s ephemeral: the file is scoped to that chat and won’t be there in a new conversation or a future session. Upload to a project (as above) — or ask Addison to convert it to a table — for anything you’ll want to come back to.
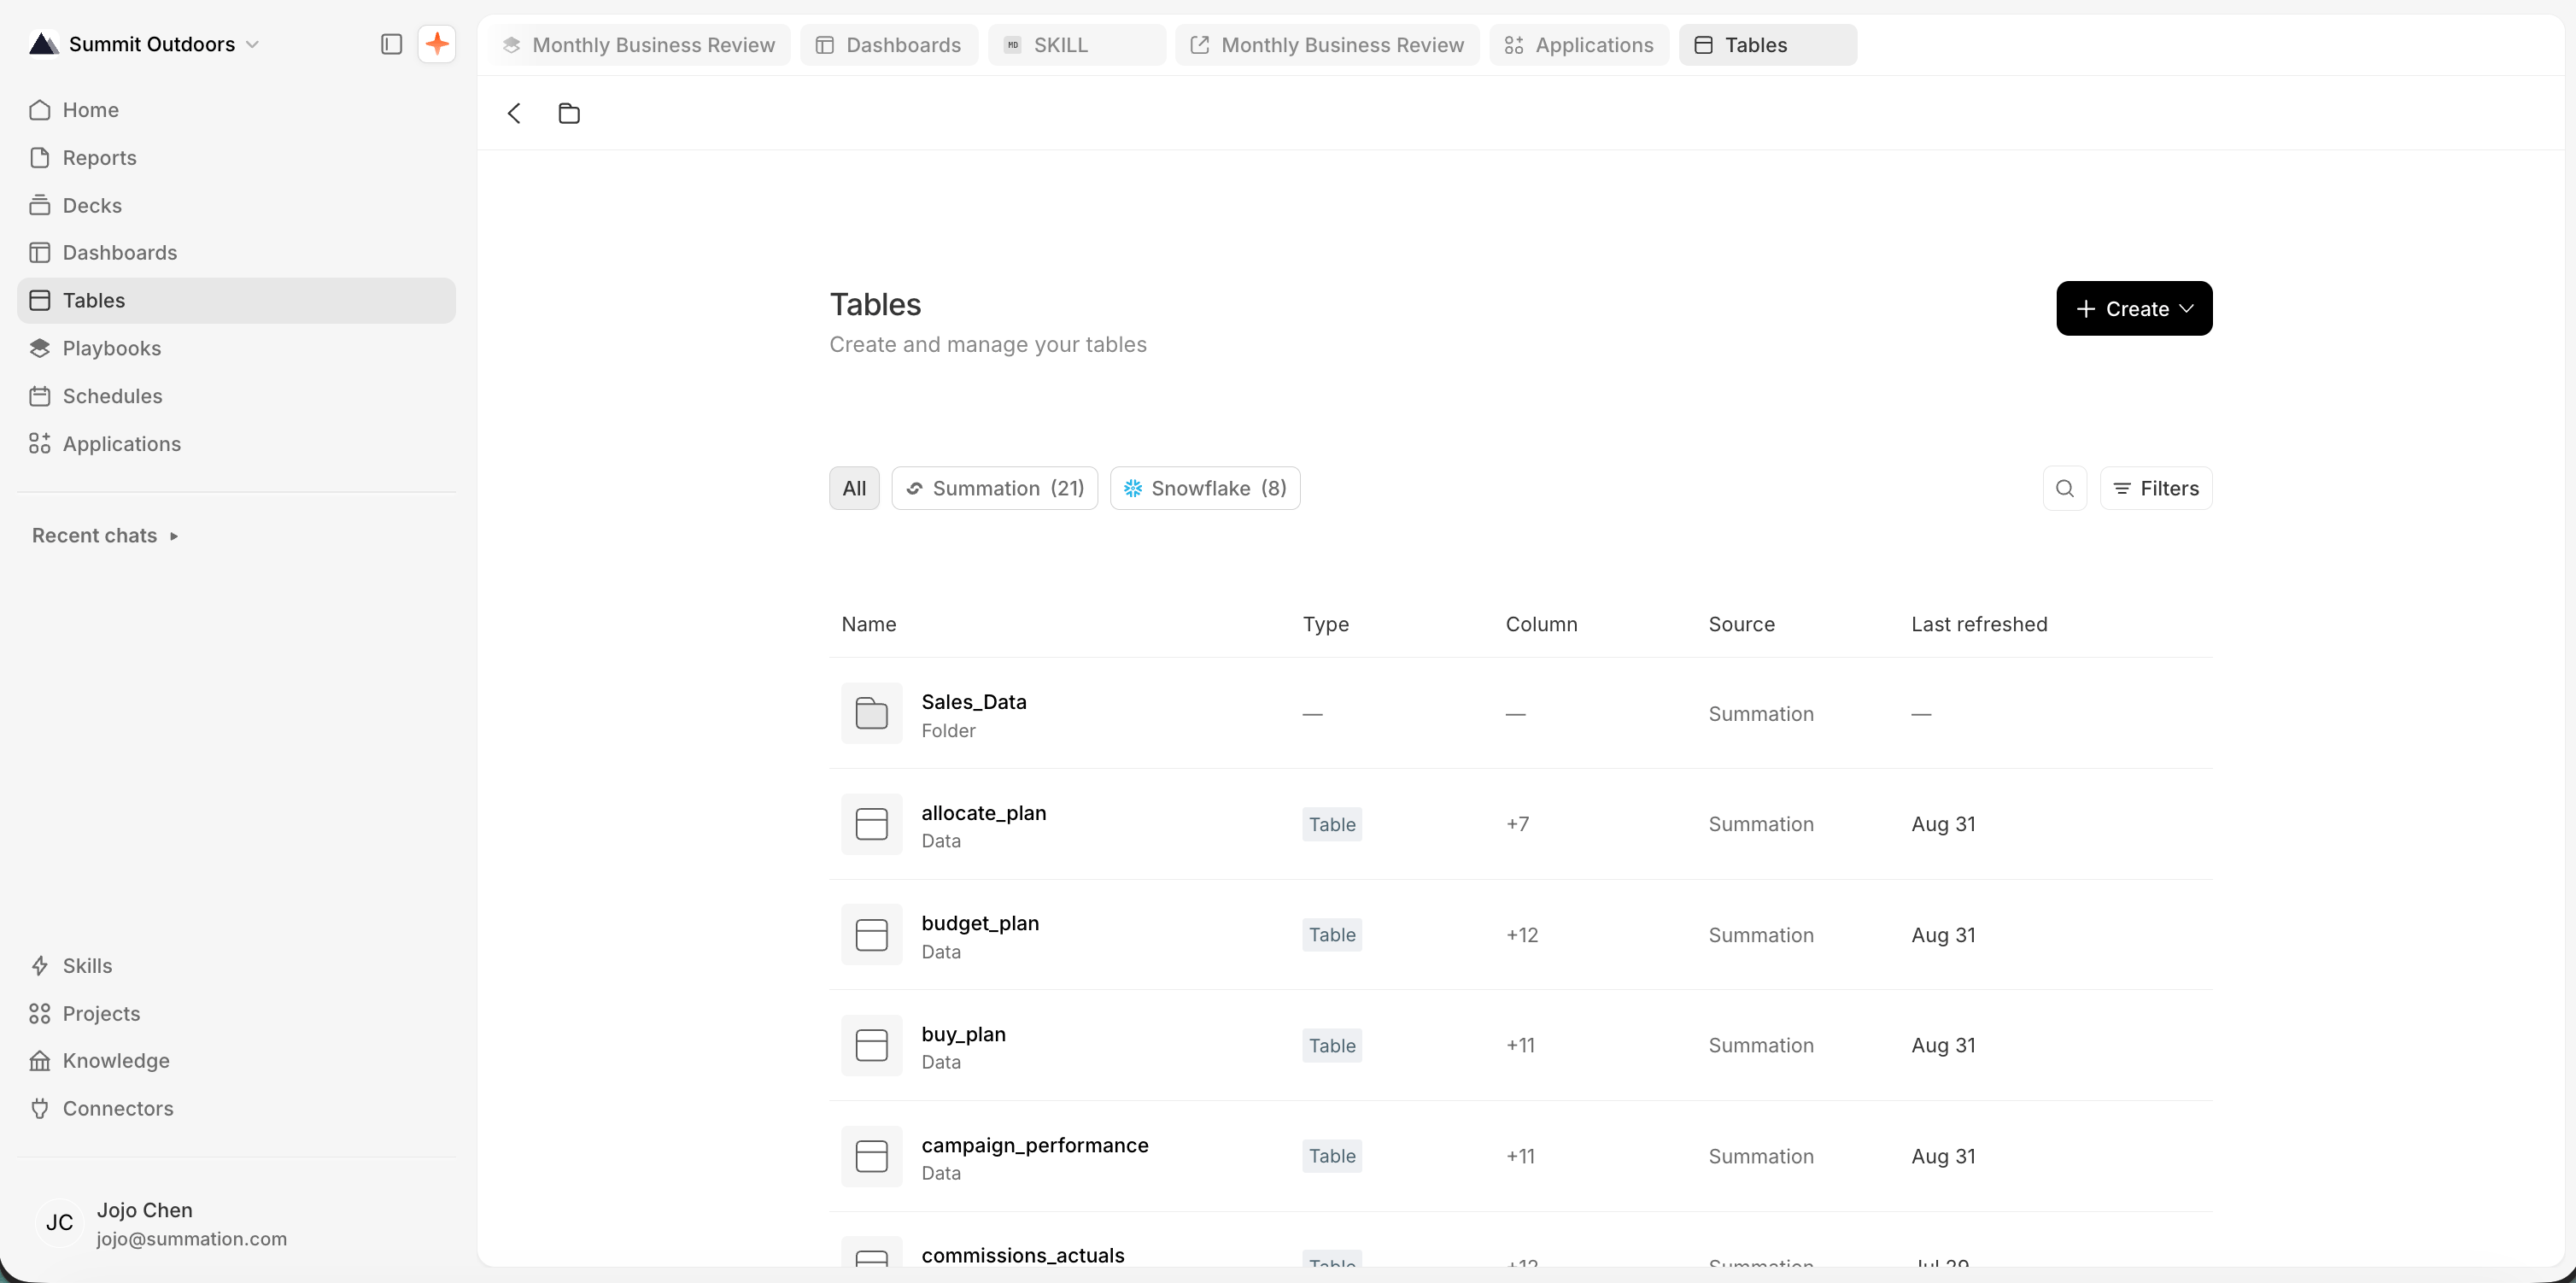
A connection puts its datasets under Tables in the left sidebar; click one to see the rows. An uploaded file shows up in its project’s file list instead, and appears under Tables only once you have asked Addison to convert it.
The Tables page
Projects keep the files and context for a task together. Attach the tables and views you need as the project’s key tables so Addison reaches for them first here. Addison can also work with uploaded project files without converting them to tables first.
Start narrow. Choose the data needed for one question. You can add business context as you review the answer.