Step 2 of 4. Ask Addison a business question, turn the answer into a report, and check the result. Open the project with your data and start with one specific question. If a definition matters to the answer, include it in your message. You don’t need to set up business rules first.

Put Addison to work

Addison is the AI analyst. The composer sits in the middle of Home, and the sparkle button at the top of the left sidebar opens it from anywhere else. Pick your project with the grid icon in the composer. That’s what decides which tables and which context Addison has. Then describe the work the way you’d hand it to a colleague who knows the data:
Which regions grew fastest last quarter, and what drove it?
Addison analyzes the data, reads the results, and explains what it did. You don’t need to know the schema or write a query.
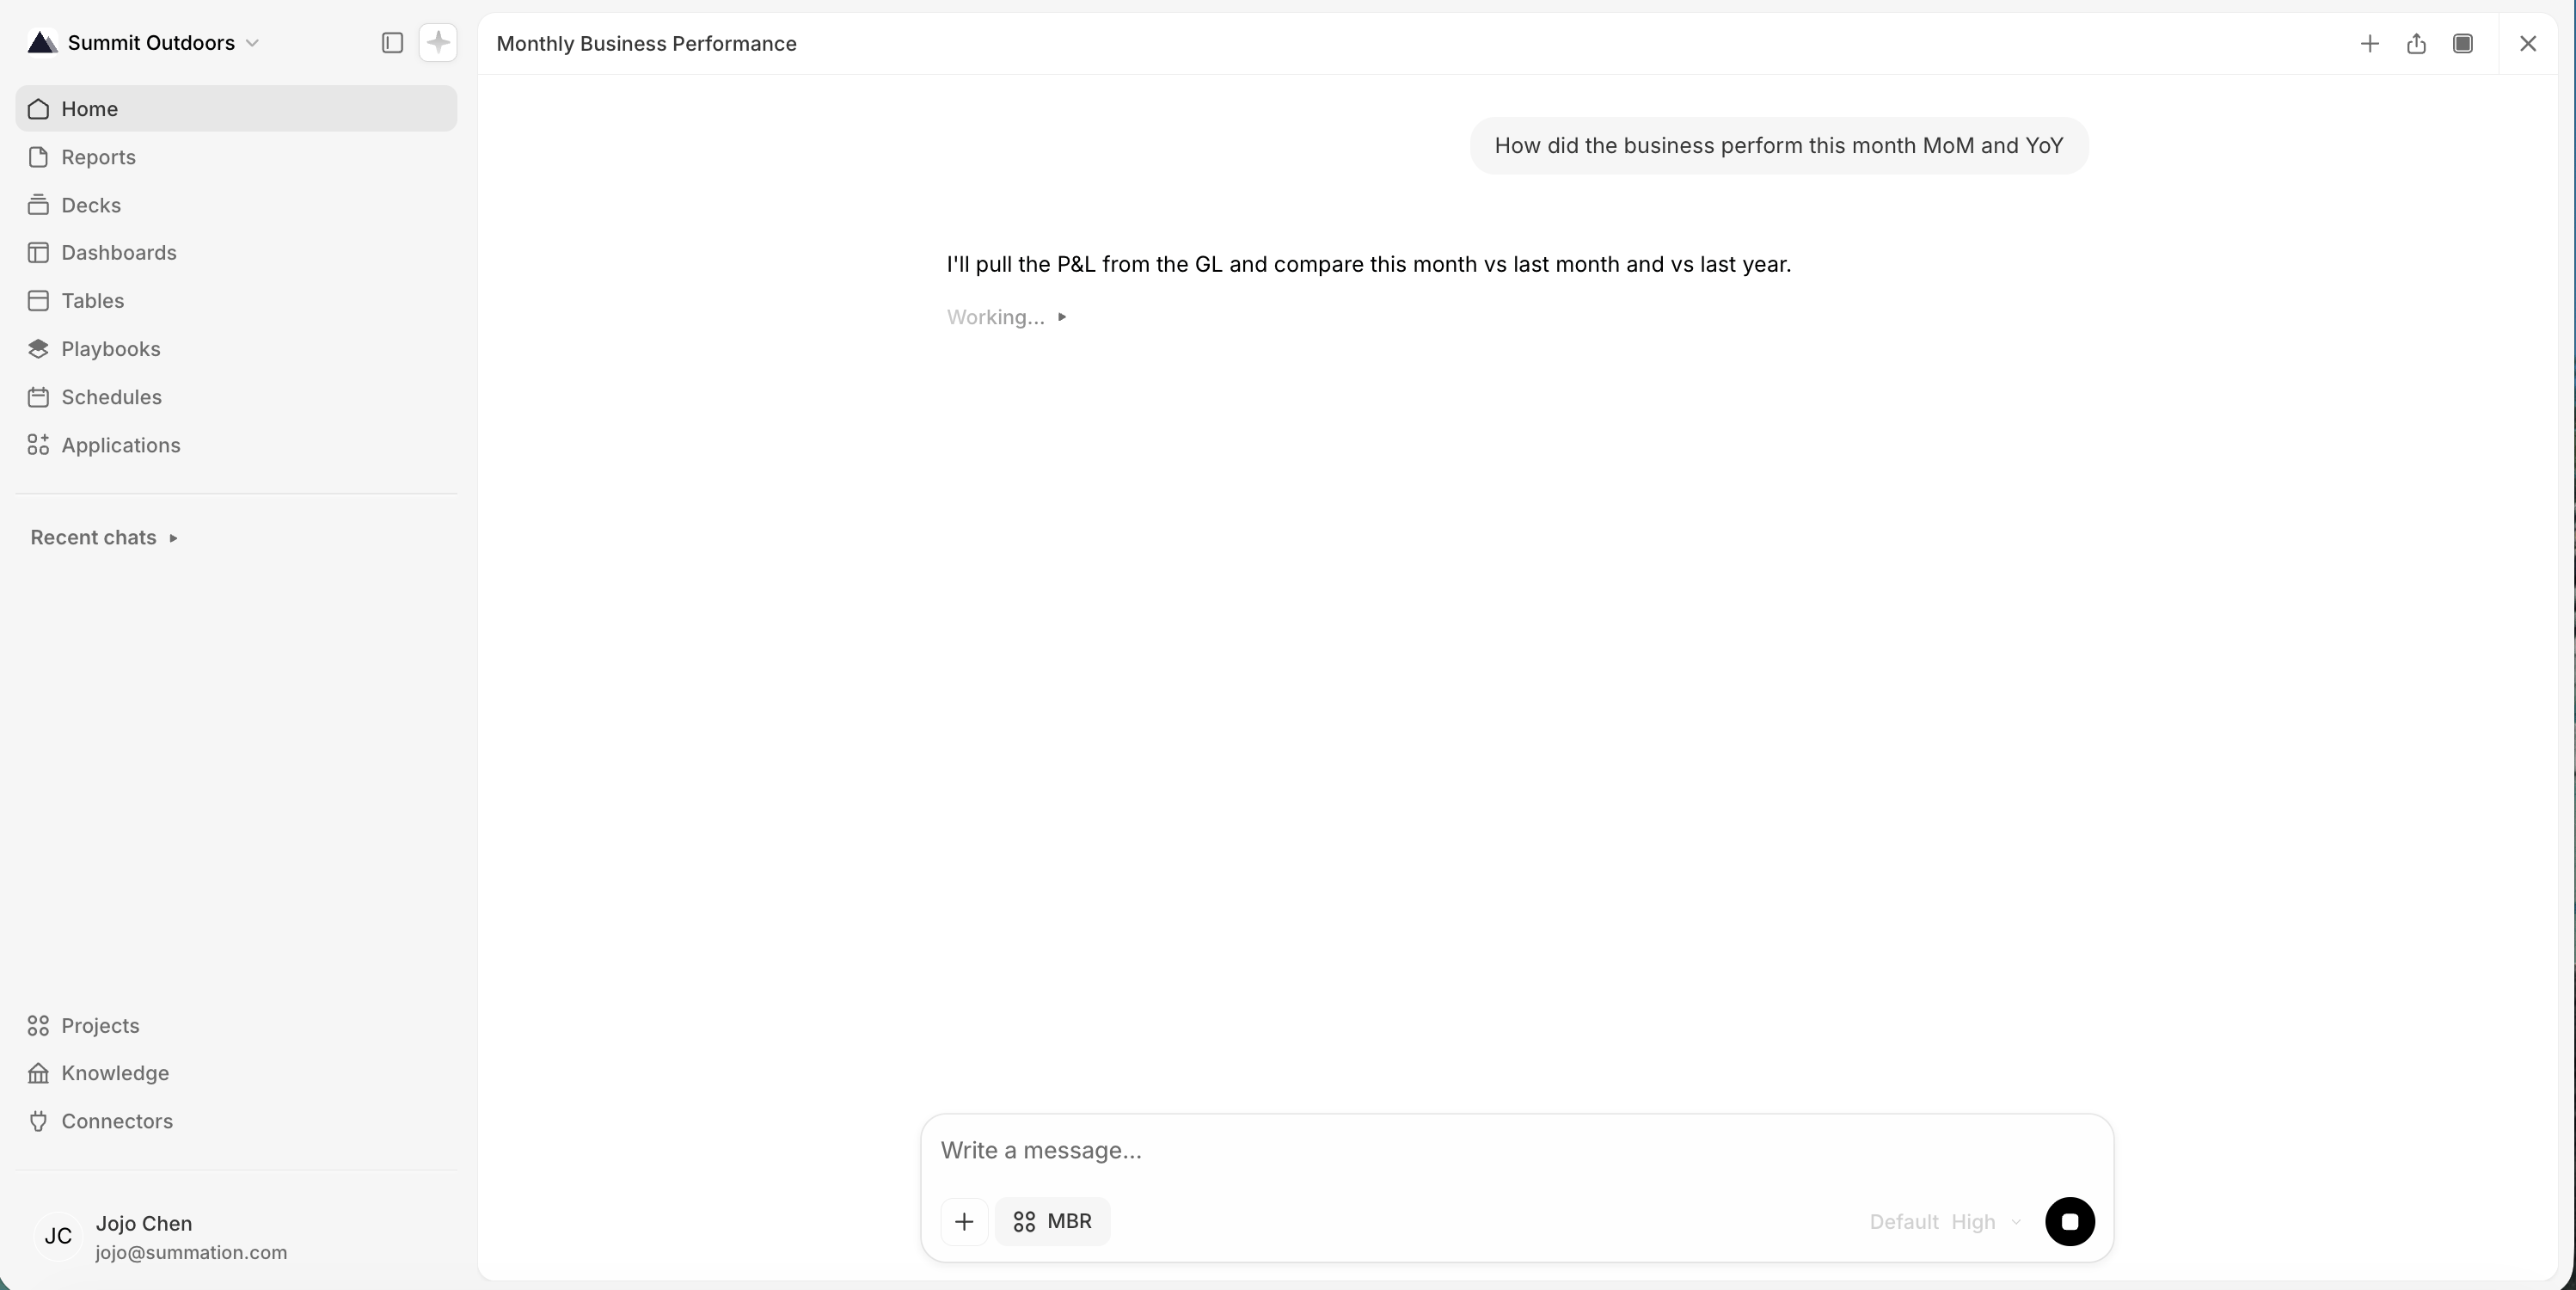
An Addison chat titled 'Monthly Business Performance' with the user message 'How did the business perform this month MoM and YoY', followed by Addison's reply 'I'll pull the P&L from the GL and compare this month vs last month and vs last year.' and a collapsed 'Working...' step.

Addison working through a request

Two shortcuts in the composer: / opens the skills menu, and @ finds a file in the project to talk about.
Ask follow-ups in the same thread. The thread keeps its context, so “now split that by channel” does what you’d expect.

Turn the answer into an artifact

An artifact turns an answer into something durable: a saved document in your project rather than a message in a thread. There are three main kinds, and the right one depends on who’s going to read it. Ask for one in the thread you already have (“turn that into a report”), or use Create in the project’s file list. Either way it arrives as a card at the end of Addison’s response with an Open button.
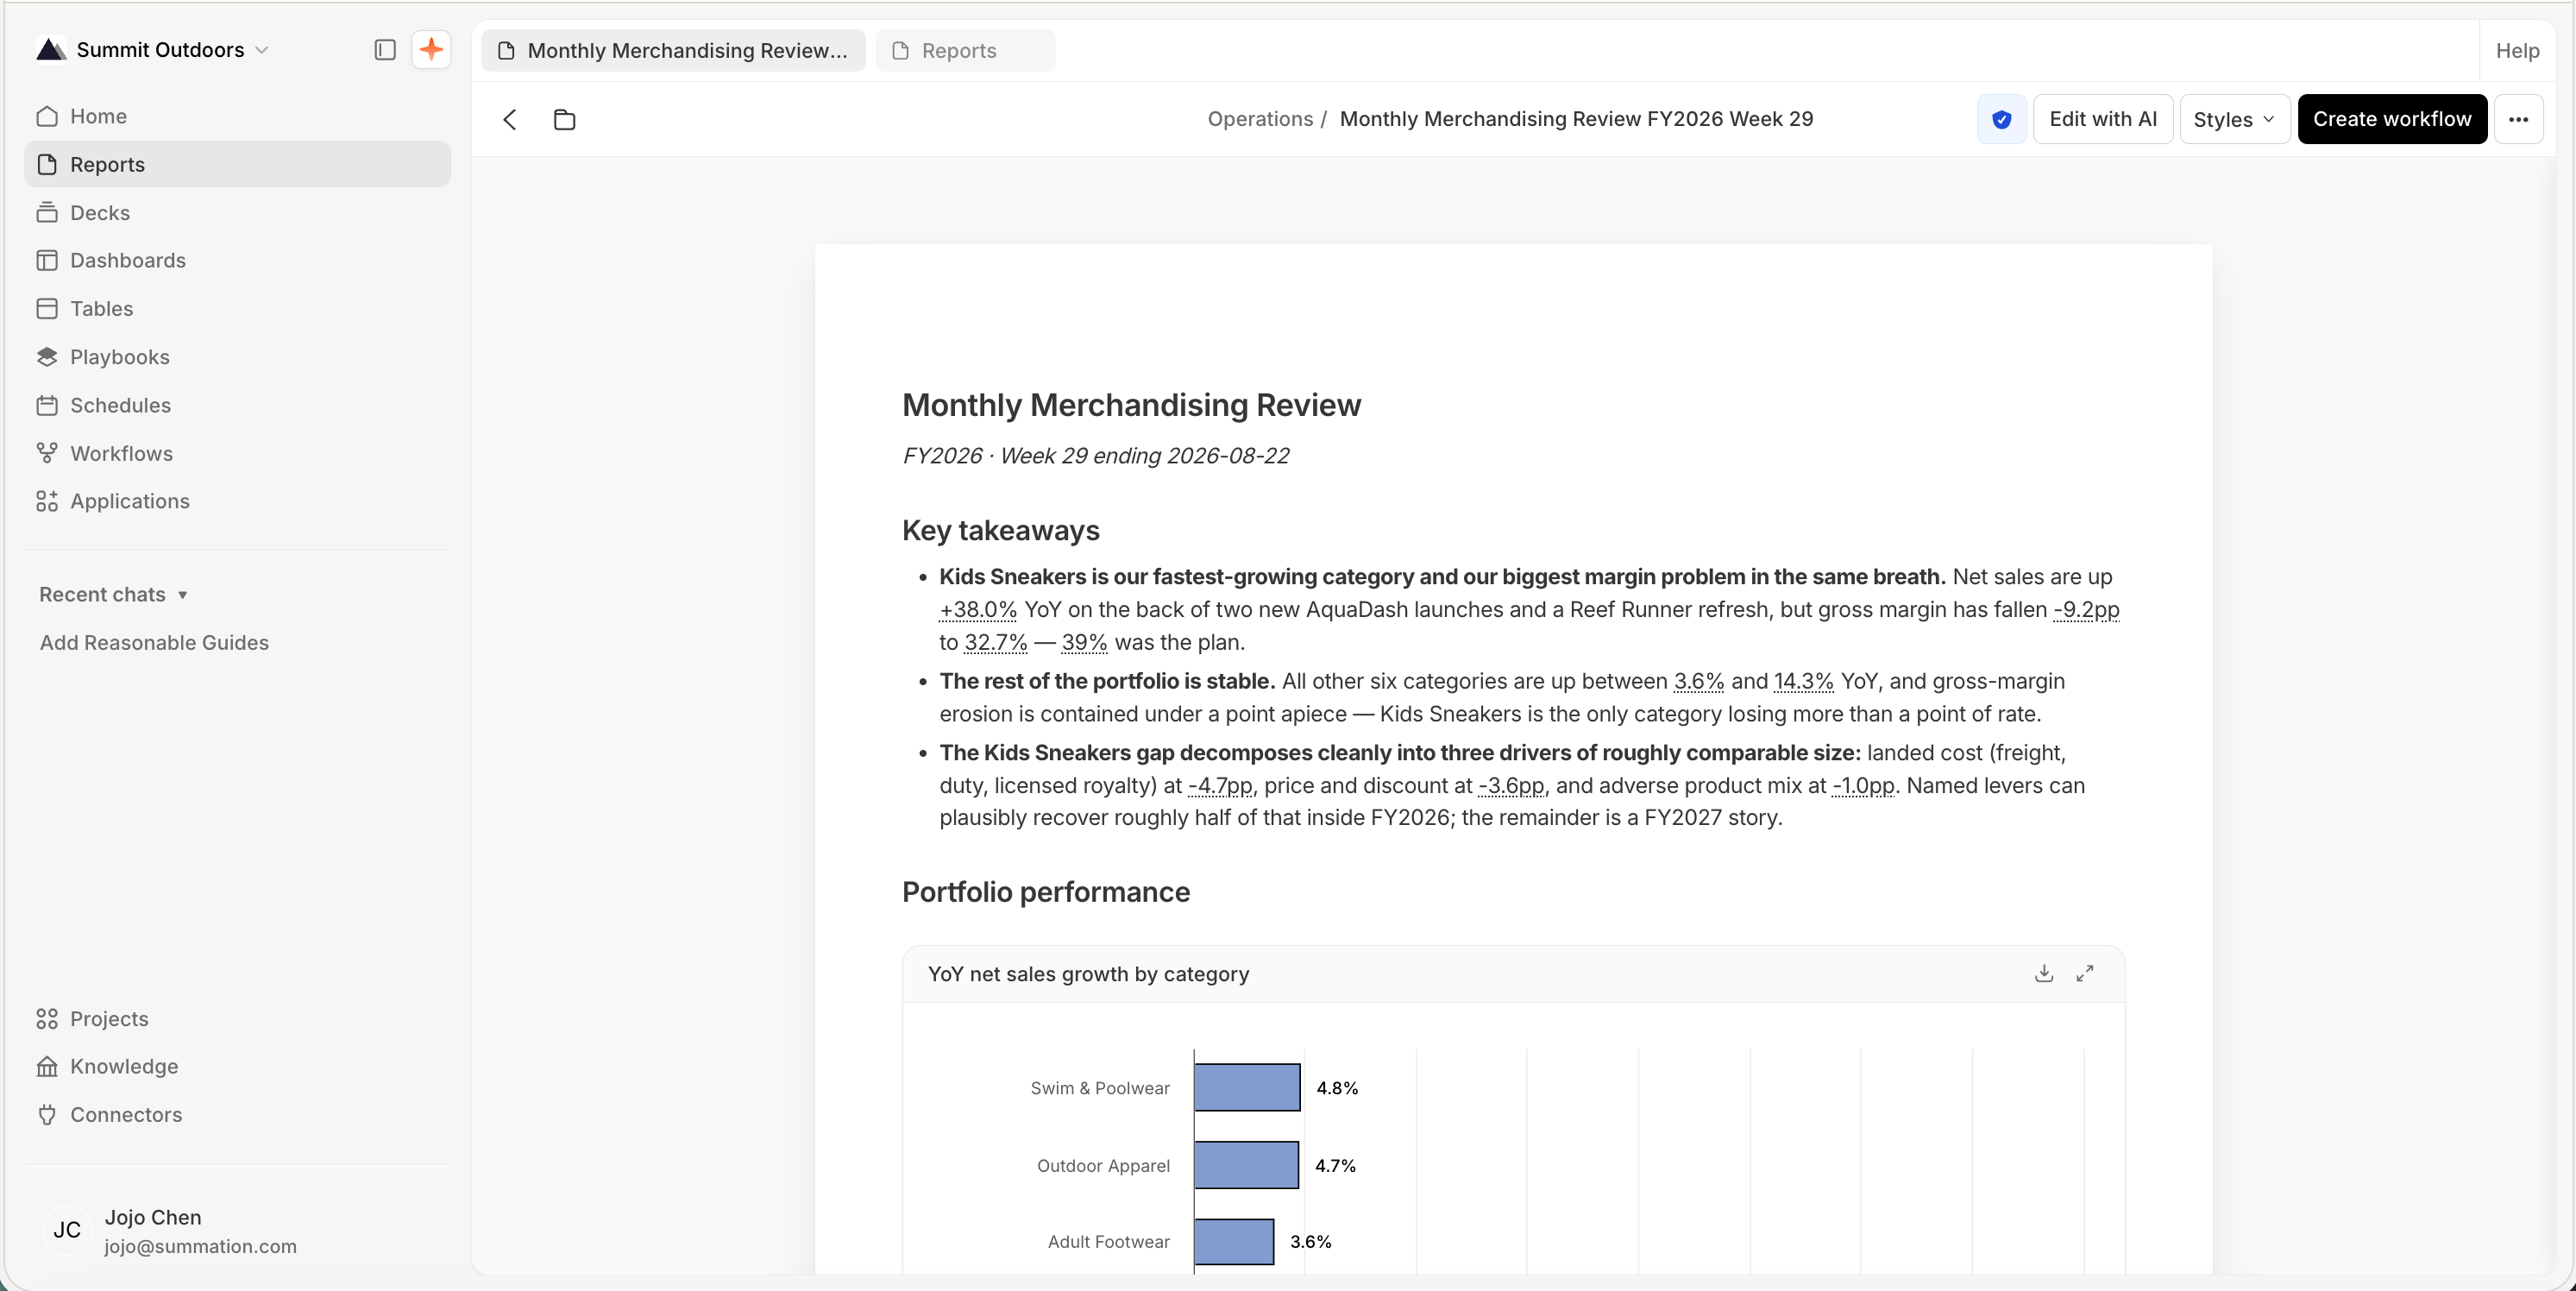
An example report titled 'Monthly Merchandising Review' (Operations / Monthly Merchandising Review FY2026 Week 29), with a verified checkmark, Edit with AI, Styles, and Create workflow in the toolbar. The body has a 'Key takeaways' section with three bulleted findings and underlined citations (net sales +38.0%, gross margin -9.2pp, 32.7% vs 39% plan), and a 'Portfolio performance' section with a 'YoY net sales growth by category' bar chart.

An example report: written analysis with data citations, key actions, and charts

Addison also produces Excel workbooks and HTML pages as file outputs. They live in your project files rather than having their own home in the sidebar.

Let Addison verify it

Verification checks the report’s numbers, sources, and claims. Click the verification badge (the shield) in the toolbar and choose Verify. The Verification Hub shows results across four dimensions, each with a count of the checks that passed:
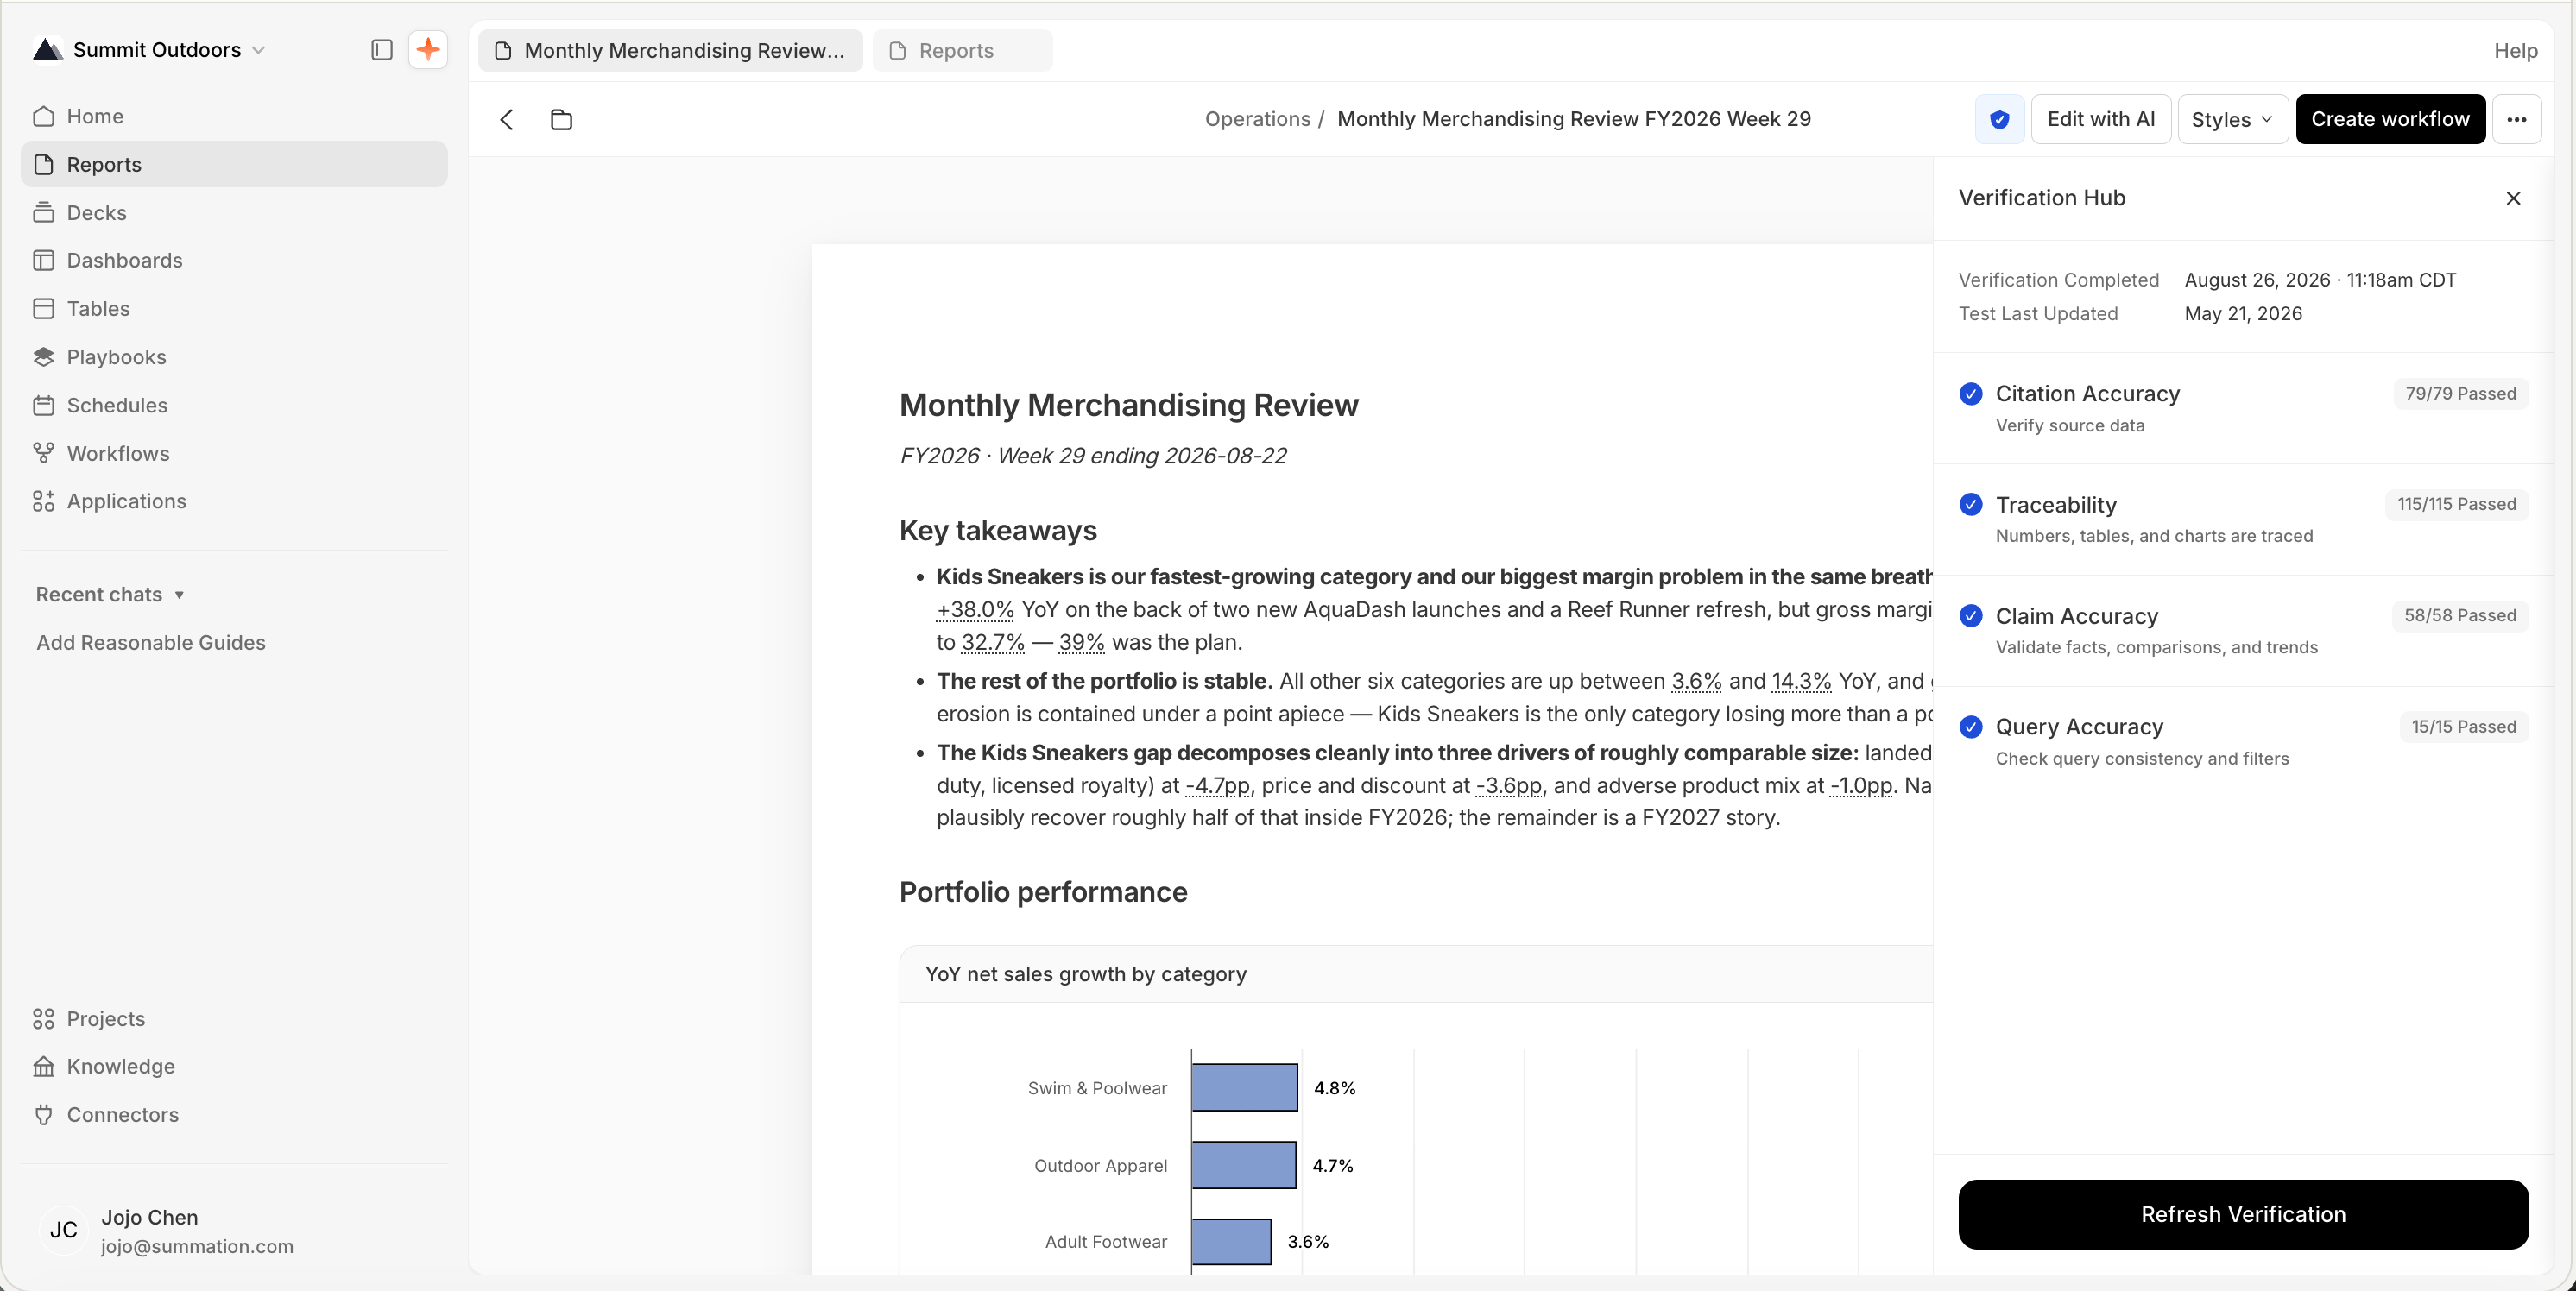
The report toolbar (shield badge, Edit with AI, Styles, Create workflow, ⋯) with the Verification Hub panel open alongside 'Monthly Merchandising Review'. It shows 'Verification Completed August 26, 2026, 11:18am CDT' and 'Test Last Updated May 21, 2026', then four dimensions all passed: Citation Accuracy 79/79, Traceability 115/115, Claim Accuracy 58/58, and Query Accuracy 15/15, with a Refresh Verification button at the bottom.

The Verification Hub, opened from an artifact's toolbar

After that the badge carries the state on its own (Verified, Failed, or Stale once you’ve edited the report), so you can tell where a document stands without opening the Hub. Spot-check anything that surprises you. Cited numbers are underlined; click one and a Value trace shows the query result and the exact cell behind it. Use it to understand the finding and explain where the number came from. Fix it by asking. If verification flags something, tell Addison. Select the text or the chart and use Edit with AI to correct that spot rather than regenerating the document. If the cause is a business definition, such as the wrong revenue rule or fiscal calendar, save the correction as business context so future analyses can use it.
Run verification again whenever the report changes.

Review your first result

Check that the report answers your question, uses the right data, and has a current verification result. Once you’ve reviewed it, you can share it. If this was a one-time task, you can stop here.

Next: build on your analysis

Save useful definitions or corrections in the context step. Or go straight to Automate your first workflow to repeat the analysis on a schedule.

Refine your business context

Step 3: save what you’ve learned so future analyses can use it.